. 2012 Feb 1;188(3):1036-48.
doi: 10.4049/jimmunol.1102500. Epub 2011 Dec 23.

Regulatory B10 cells differentiate into antibody-secreting cells after transient IL-10 production in vivo

Affiliations

Regulatory B10 cells differentiate into antibody-secreting cells after transient IL-10 production in vivo

Damian Maseda et al. J Immunol. .

Abstract

Regulatory B cells that are functionally defined by their capacity to express IL-10 (B10 cells) downregulate inflammation and autoimmunity. In studies using well-defined IL-10 reporter mice, this rare B10 cell subset was also found to maintain a capacity for plasma cell differentiation. During a transient period of il10 transcription, the blimp1 and irf4 transcription factors were induced in B10 cells, whereas pax5 and bcl6 were downregulated as a significant fraction of B10 cells completed the genetic and phenotypic program leading to Ab-secreting cell differentiation in vitro and in vivo. B10 cell-derived IgM reacted with both self- and foreign Ags, whereas B10 cells generated Ag-specific IgG in response to immunizations. Moreover, B10 cells represented a significant source of serum IgM and IgG during adoptive-transfer experiments and produced Ag-specific, polyreactive and autoreactive Ab specificities that were consistent with their expression of a diverse AgR repertoire. Thereby, B10 cells limit inflammation and immune responses by the transient production of IL-10, and may facilitate clearance of their eliciting Ags through an inherent capacity to quickly generate polyreactive and/or Ag-specific Abs during humoral immune responses.


Figures
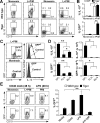
Figure 1
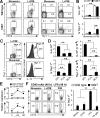
Figure 1. B cell GFP expression in Tiger mice parallels cytoplasmic IL-10 expression
(A) B cell IL-10 production relative to GFP expression in Tiger mice. Splenocytes were cultured for 5 h with L+PIM before cell surface CD19 and cytoplasmic IL-10 immunofluorescence staining with flow cytometry analysis. Cells cultured with monensin alone served as negative controls for IL-10 staining, with results similar to isotype control mAb staining (not shown). Representative contour plots show the IL-10+, IL-10+GFP+ and GFP+ cell frequencies within the indicated gates for CD19+ B cells (n=5 mice). (B) Mean IL-10+ and GFP+ B cell frequencies (±SEM) in wild type and Tiger mice (n=5 mice/group) as identified in (A). (C) Representative IL-10 expression by GFP+ B cells in Tiger mice. GFP+ and GFP CD19+ B cells were assessed for IL-10 expression (thick lines) relative to control mAb staining (shaded histograms) after 5 h L+PIM stimulation (n=5 mice) as in (A). (D) Mean frequencies and numbers of IL-10+ and GFP+ B cells in tissues of Tiger mice among CD19+ B cells from spleen (SPL), peripheral lymph nodes (PLN, inguinal), or mesenteric lymph node (MLN) (≥3 mice) as in (A). (E) GFP expression by B10+B10pro cells from Tiger mice. Spleen CD19+ cells were cultured for 48 h in media alone or with agonistic CD40 mAb, LPS or anti-IgM antibody. Monensin, L+PIM or PIM were added during the final 5 h of culture, with IL-10+ or GFP+ B cells identified as in (A). Cultured spleen B cells from wild type mice served as background controls for GFP expression. Bar graphs show mean frequencies of GFP+ B cells after culture (n≥3 mice/group). (B, D, E) Significant differences between cultures with media alone or between values are indicated: *p<0.05, **p≤0.01. All experiments were performed ≥3 times.
Figure 2
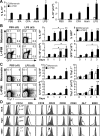
Figure 2. Divergent IL-10 and Thy1.1 expression by 10BiT B cells
(A) B cell IL-10 production relative to cell surface Thy1.1 expression in 10BiT mice. Splenocytes were stimulated for 5 h before IL-10 and CD19 staining as in figure 1A. Representative contour plots show the IL-10+, IL-10+Thy1.1+ and Thy1.1+ cell frequencies within the indicated gates for CD19+ B cells. (B) Mean IL-10+ and Thy1.1+ B cell frequencies in wild type and 10BiT mice (n=5 mice/group) as in (A). (C) Representative IL-10 expression by Thy1.1+ B cells in 10BiT mice. Thy1.1+ and Thy1.1 CD19+ B cells were assessed for IL-10 expression (thick lines) relative to control mAb staining (shaded histograms) after 5 h cultures with L+PIM (n=5 mice) as in (A). (D) Mean frequencies and numbers of tissue IL-10+ or Thy1.1+ B cells in spleen (SPL), lymph nodes (PLN), or mesenteric lymph node (MLN) of 10BiT mice (n≥3 mice) as in (A). (E) Relative il10 and thy1.1 transcript expression by B cells from 10BiT mice. Purified CD1dhiCD5+ (black boxes) and CD1dloCD5 (empty boxes) CD19+ B cells were cultured alone or with LPS for 5, 24 and 48 h prior to RNA isolation and reverse transcriptase quantitative real-time PCR analysis. Values were normalized to the CD1dloCD5 population at each time point, with relative values shown as mean frequencies from 3 experiments. (F) Thy1.1 expression by B10+B10pro cells from 10BiT mice. Contour plots and bar graphs (representative of two experiments) show mean frequencies of Thy1.1+ spleen CD19+ B cells from wild type (background controls) and 10BiT mice (n≥3 mice/group) after 48 h cultures with the indicated stimuli as in figure 1E. (B, D, F) Significant differences between cultures with media alone or between the indicated values are indicated: **p≤0.01. Unless indicated, all experiments were performed ≥3 times.
Figure 3
Figure 3. B10 cells expand after in vivo LPS treatment
(A) Alum and LPS drive B10 cell expansion in vivo. Spleen B10 cell numbers were quantified as in figure 1, three days after PBS, CFA, IFA, alum or LPS treatment. Values represent mean frequencies or numbers of IL-10+ CD19+ B cells from one of two experiments with similar results (n≥3 mice/group/experiment). (B) LPS drives GFP+ B10 cell expansion in Tiger mice. Representative contour plots show IL-10 and GFP expression by spleen CD19+ B cells 3 days after PBS or LPS treatment. B cells were cultured with monensin alone or L+PIM for 5 h before IL-10 and GFP analysis as in figure 1A. Bar graphs show mean frequencies or numbers of IL-10+ or GFP+ B cells from PBS- (d 3) or LPS-treated (days 1–3) mice (≥3 mice/group). (C) LPS treatment drives Thy1.1+ B10 cell expansion in 10BiT mice. Representative contour plots and bar graphs indicate frequencies and total numbers of IL-10+ or Thy1.1+ B cells from 10BiT mice (3–4 mice per group) as assessed in (B). (A–C) Means significantly different from PBS-treated control mice are indicated: *p≤0.05, **p≤0.01. Data presented in Fig. 3B–C were pooled from 3 independent experiments. (D) Ex vivo cell surface phenotype of B cells from wild type, Tiger or 10BiT mice. Spleen B cells were isolated 3 days after LPS treatment, with subsequent L+PIM stimulation for 5 h before cell surface staining. Open histograms (thick lines) represent the IL-10+, GFP+ or Thy1.1+ B cell subsets, while shaded histograms represent IL-10, GFP- or Thy1.1 B cells, as indicated. Similar results were obtained in 2 experiments.
Figure 4
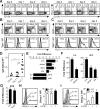
Figure 4. B10 cells differentiate into ASC in vivo
(A) Representative spleen GFP+ or Thy1.1+ cell frequencies versus CD138 expression among B220hi/int B cells in Tiger (left) and 10BiT (right) mice before (day 0) or 1–3 days following LPS treatment. Numbers within quadrants indicate means (n=3–5 mice). (B) Spleen CD138hiB220int/lo B cells in Tiger mice express GFP after LPS treatment in vivo. Representative contour plots show CD138hiB220lo B cell frequencies in Tiger mice before (day 0) or 1–3 days following LPS treatment. Representative histograms indicate GFP expression by CD138hiB220int/lo B cells at the same time points (heavy lines, lower panels) relative to CD138hiB220int/lo B cells from wild type mice as negative controls (shaded lines). Mean CD138hiB220int/lo B cell frequencies or percentages of reporter-positive cells within the indicated gates are shown with backgrounds subtracted (n=3–5 mice). (C) CD138hiB220int/lo B cells in 10BiT mice express Thy1.1 before and after LPS treatment in vivo. Representative contour plots and histograms are shown as in (B). (D) Thy1.1+ B10 cells secrete IgM in vitro. Purified spleen B cells from 10BiT mice given LPS 3 days earlier were sorted into Thy1.1+ or Thy1.1 CD19+ cell fractions and cultured on ELISpot plates overnight to enumerate IgM-secreting cells from 3–8 individual mice. (A–D) Data are pooled from 3 independent experiments. (E) Thy1.1+ B10 cells express transcription factors associated with plasma cell differentiation. Spleen Thy1.1+ or Thy1.1 CD19+ B cells were purified from 10BiT mice given LPS 3 days earlier, with relative transcription factor expression measured by reverse transcriptase quantitative real-time PCR. Bars indicate mean fold differences between Thy1.1+ B cells normalized to Thy1.1 B cells from 3 experiments (n=5 mice/experiment). (F) B10 cells from wild type mice express blimp1 and irf4. Purified spleen CD1dhiCD5+ and CD1dloCD5 B cells were stimulated with L+PI for 5 h (B10 cells) or were cultured with CD40 mAb for 48 h with L+PI added during the final 5 h (B10+B10pro cells). Values indicate mean fold differences between CD1dhiCD5+ and CD1dloCD5 B cells (n=3 mice). (G) IL-10+ B10 cells from wild type mice express blimp1. B cells were stimulated with L+PI for 5 h before IL-10+ and IL-10 CD19+ B cells were purified. Values indicate mean fold differences between IL-10+ and IL-10 B cells (n=3 mice). (F–G) il10, irf4 and blimp1 transcripts were quantified as in (E). (H) Intracellular Blimp-1 expression by spleen IL-10+, IL-10 or monensin only-treated B cells following 5 h of L+PIM stimulation. (I) Intracellular Blimp-1 levels in IL-10+, IL-10 or monensin only treated cells following 24 h LPS stimulation with PIM added during the final 5 h. (H–I) Mean MFI values for the indicated populations are shown (n=3 mice). (D–I) Significant differences between means are indicated: *p≤0.05, **p≤0.01.
Figure 5
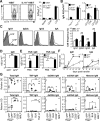
Figure 5. B10 cells produce Ag-specific antibody and autoantibodies
(A) IL-10 is not required for B10+B10pro cell development in 10BiT mice. Splenocytes from 10BiT or IL-10−/−10BiT mice were cultured for 48 h with media alone, CD40 mAb, or LPS, with the frequency of Thy1.1+ B10+B10pro cells determined as in figure 1E. Representative contour plots show CD19+ B cells from LPS-stimulated cultures. Bar graphs indicate relative mean frequencies of Thy1.1+ cells among CD19+ B cells (n=3 mice/group). (B) IL-10 expression is not required for B10 cell differentiation into ASCs. 10BiT or wild type mice (open bars) and IL-10−/−10BiT or IL-10−/− mice (filled bars) were given LPS 3 days before relative ASC frequencies were determined among Thy1.1+ or Thy1.1 subsets from 10BiT mice and CD1dhiCD5+ or CD1dloCD5 subsets from wild type mice as in fig. 4D (n=3 mice/group, data represent 2 experiments). (C) B10 cell expression of cell surface IgG and IgA. Spleen B cells from wild type mice were stimulated with L+PIM for 5 h before staining for IL-10 and cell surface IgG and IgA. Bar graphs show mean frequencies of B cells expressing each isotype (n=8 mice/group) from 2 experiments. (D) B10 cells from Tiger mice can secrete IgM. Purified spleen CD19+ B cells from Tiger mice were stimulated for 5 h with L+PI before GFP+ and GFP B cells were isolated by cell sorting. After 18 h of culture with LPS, the cells were cultured on ELISpot plates for 5 h. Bar graphs show mean IgM ASC frequencies (n=3 mice/group). (E) B10 cells can secrete Ag-specific IgM and IgG. Tiger mice were immunized with TNP-KLH plus alum, or PBS plus alum. Spleen TNP-specific IgM and IgG ASCs were quantified 7 days later using ELISpot assays as in (B). Bar graphs indicate mean ASC frequencies from 2 PBS- and 3 TNP-immunized mice in 2 experiments. (F) B10 cells contribute to serum antibody titers in vivo. In 2 experiments, purified spleen B cells from 4 or 8 Tiger mice were pooled and cultured overnight (18 h) with LPS, followed by 5 h stimulation with L+PI to induce GFP expression. Cell sorter purified GFP+ (closed squares) and GFP (open squares) B cells were then transferred into 5 and 6 Rag2−/− recipients, respectively. Serum was collected at the indicated times, with antibody levels quantified by ELISA. Background IgM and IgG levels were determined using serum from untreated Rag2−/− mice (dashed lines). (G) Reactivity of antibodies produced by B10 cells. Serum from Rag2−/− mice given GFP+ (closed squares) or GFP (open squares) B cells 10 days earlier (as in D) was analyzed for reactivity with the indicated Ags by ELISA. Positive and negative controls included pooled sera from two-month-old wild type mice before (closed triangles) and 7 days after (diamonds) TNP-KLH-immunization, 10-month-old CD22−/− mice (open circles), and a 6-month-old female MRLlpr mouse (open triangles). Values indicate results from individual mice. (A–G) Means significantly different between groups are indicated: *p≤0.05, **p≤0.01.
Figure 6
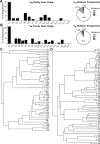
Figure 6. B10 cells utilize diverse V genes that are largely unmutated
(A) VH family gene usage by 50 representative IL-10+ B cells from 3 individual mice. Mutation frequencies within the VH-D-JH gene sequences are shown on the right. (B) VK gene family usage by 69 representative IL-10+ B cells. VK-JK mutation frequencies are shown on the right. (C) Phylogenetic tree showing relationships between the VH-D-JH amino acid sequences of individual B cells from mice named A–C with numbers indicating different B cells. Branches indicate the average distance between two sequences based on percent identity. (D) Phylogenetic tree showing the relationship between the VK-JK amino acid sequences of individual B cells.
Figure 7
Figure 7. B10 cells regulate antibody production in vivo
Model for B10 cell maturation and antibody production. Transient B10 cell IL-10 production parallels GFP expression in IL-10 reporter mice, while cell surface Thy1.1 expression is observed later and accumulates over time. Although other B10 cell fates are possible, some spleen B10 cells differentiate into ASC cells that predominantly produce IgM. Antibody production by B10-derived B cells may constitute a second wave of humoral regulation during immune responses.

Similar articles

Cited by

  • Frontiers of Autoantibodies in Autoimmune Disorders: Crosstalk Between Tfh/Tfr and Regulatory B Cells.
    Ding T, Su R, Wu R, Xue H, Wang Y, Su R, Gao C, Li X, Wang C. Ding T, et al. Front Immunol. 2021 Mar 26;12:641013. doi: 10.3389/fimmu.2021.641013. eCollection 2021. Front Immunol. 2021. PMID: 33841422 Free PMC article. Review.
  • Deconvolution of B cell receptor repertoire in multiple sclerosis patients revealed a delay in tBreg maturation.
    Lomakin YA, Zvyagin IV, Ovchinnikova LA, Kabilov MR, Staroverov DB, Mikelov A, Tupikin AE, Zakharova MY, Bykova NA, Mukhina VS, Favorov AV, Ivanova M, Simaniv T, Rubtsov YP, Chudakov DM, Zakharova MN, Illarioshkin SN, Belogurov AA Jr, Gabibov AG. Lomakin YA, et al. Front Immunol. 2022 Aug 16;13:803229. doi: 10.3389/fimmu.2022.803229. eCollection 2022. Front Immunol. 2022. PMID: 36052064 Free PMC article.
  • Human IL-10-producing B cells have diverse states that are induced from multiple B cell subsets.
    Glass MC, Glass DR, Oliveria JP, Mbiribindi B, Esquivel CO, Krams SM, Bendall SC, Martinez OM. Glass MC, et al. Cell Rep. 2022 Apr 19;39(3):110728. doi: 10.1016/j.celrep.2022.110728. Cell Rep. 2022. PMID: 35443184 Free PMC article.
  • Guidelines for the use of flow cytometry and cell sorting in immunological studies (third edition).
    Cossarizza A, Chang HD, Radbruch A, Abrignani S, Addo R, Akdis M, Andrä I, Andreata F, Annunziato F, Arranz E, Bacher P, Bari S, Barnaba V, Barros-Martins J, Baumjohann D, Beccaria CG, Bernardo D, Boardman DA, Borger J, Böttcher C, Brockmann L, Burns M, Busch DH, Cameron G, Cammarata I, Cassotta A, Chang Y, Chirdo FG, Christakou E, Čičin-Šain L, Cook L, Corbett AJ, Cornelis R, Cosmi L, Davey MS, De Biasi S, De Simone G, Del Zotto G, Delacher M, Di Rosa F, Di Santo J, Diefenbach A, Dong J, Dörner T, Dress RJ, Dutertre CA, Eckle SBG, Eede P, Evrard M, Falk CS, Feuerer M, Fillatreau S, Fiz-Lopez A, Follo M, Foulds GA, Fröbel J, Gagliani N, Galletti G, Gangaev A, Garbi N, Garrote JA, Geginat J, Gherardin NA, Gibellini L, Ginhoux F, Godfrey DI, Gruarin P, Haftmann C, Hansmann L, Harpur CM, Hayday AC, Heine G, Hernández DC, Herrmann M, Hoelsken O, Huang Q, Huber S, Huber JE, Huehn J, Hundemer M, Hwang WYK, Iannacone M, Ivison SM, Jäck HM, Jani PK, Keller B, Kessler N, Ketelaars S, Knop L, Knopf J, Koay HF, Kobow K, Kriegsmann K, Kristyanto H, Krueger A, Kuehne JF, Kunze-Schumacher H, Kvistborg P, Kwok I, Latorre D, Lenz D, Levings MK, Lino AC, Liotta F, Long HM, Lugli E, MacDonald KN, M… See abstract for full author list ➔ Cossarizza A, et al. Eur J Immunol. 2021 Dec;51(12):2708-3145. doi: 10.1002/eji.202170126. Epub 2021 Dec 7. Eur J Immunol. 2021. PMID: 34910301 Free PMC article. Review.
  • Chronic Lymphocytic Leukemia B-Cell Normal Cellular Counterpart: Clues From a Functional Perspective.
    Darwiche W, Gubler B, Marolleau JP, Ghamlouch H. Darwiche W, et al. Front Immunol. 2018 Apr 4;9:683. doi: 10.3389/fimmu.2018.00683. eCollection 2018. Front Immunol. 2018. PMID: 29670635 Free PMC article. Review.

References

    1. LeBien TW, Tedder TF. B-lymphocytes: How they develop and function. Blood. 2008;112:1570–1579. - PMC - PubMed
    1. DiLillo DJ, Matsushita T, Tedder TF. B10 cells and regulatory B cells balance immune responses during inflammation, autoimmunity, and cancer. Ann. N. Y. Acad. Sci. 2010;1183:38–57. - PubMed
    1. Mizoguchi A, Bhan AK. A case for regulatory B cells. J. Immunol. 2006;176:705–710. - PubMed
    1. Fillatreau S, Sweenie CH, McGeachy MJ, Gray D, Anderton SM. B cells regulate autoimmunity by provision of IL-10. Nat. Immunol. 2002;3:944–950. - PubMed
    1. Mauri C, Gray D, Mushtaq N, Londei M. Prevention of arthritis by interleukin 10-producing B cells. The Journal of experimental medicine. 2003;197:489–501. - PMC - PubMed

Publication types