. 2011 Dec 23;147(7):1498-510.
doi: 10.1016/j.cell.2011.11.054.

Mbd3/NURD complex regulates expression of 5-hydroxymethylcytosine marked genes in embryonic stem cells

Affiliations

Mbd3/NURD complex regulates expression of 5-hydroxymethylcytosine marked genes in embryonic stem cells

Ozlem Yildirim et al. Cell. .

Abstract

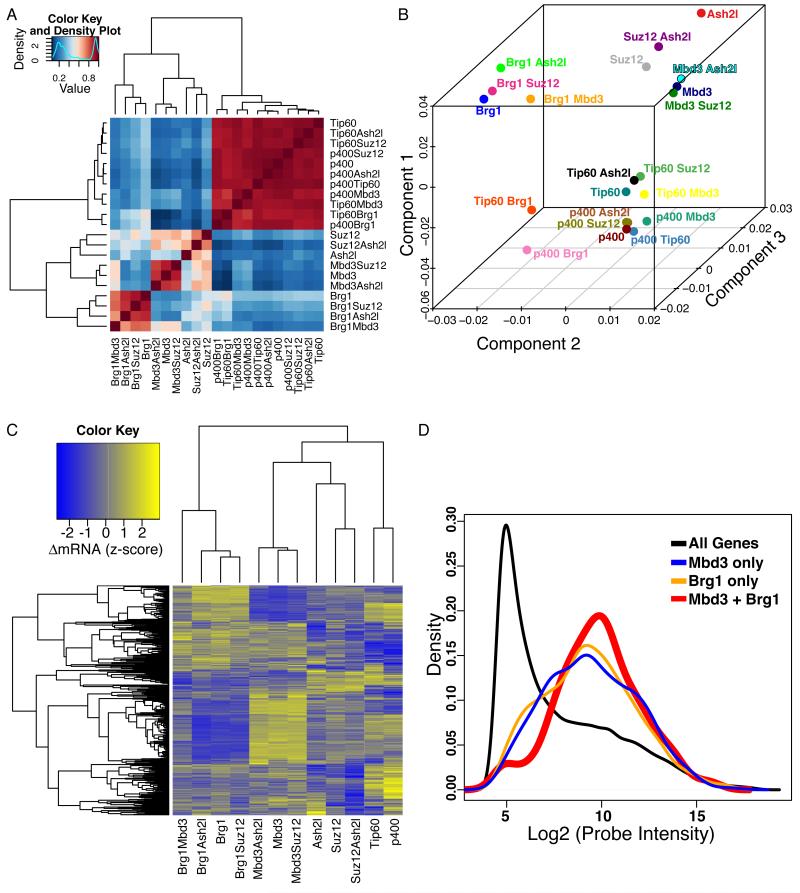
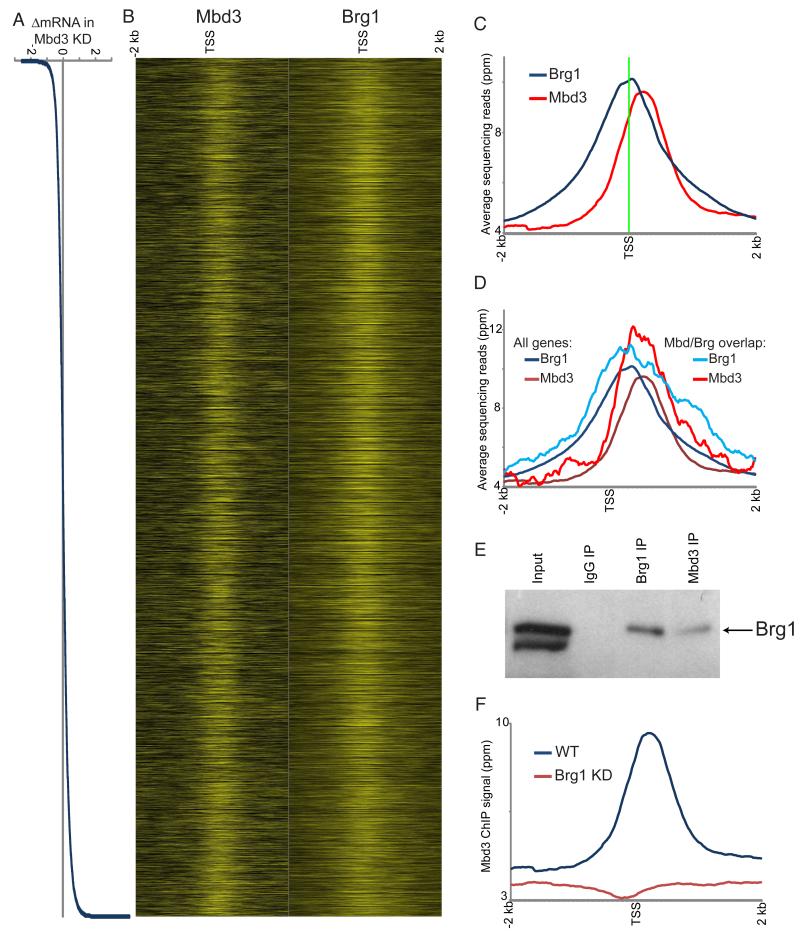
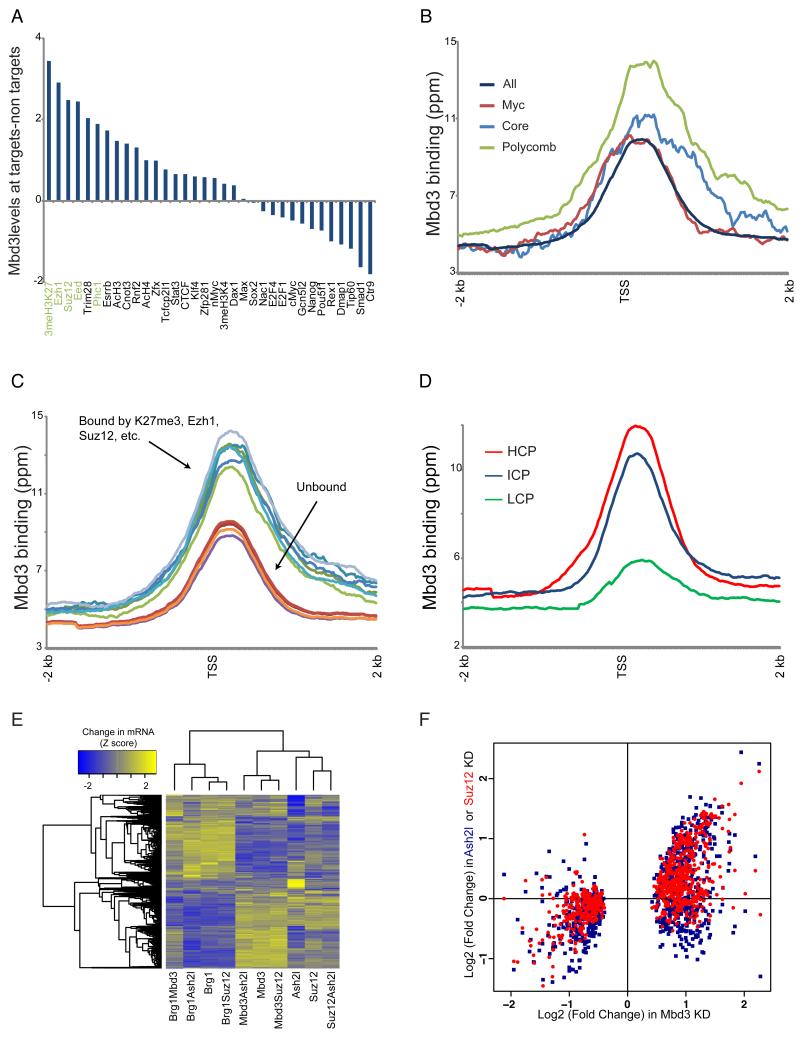
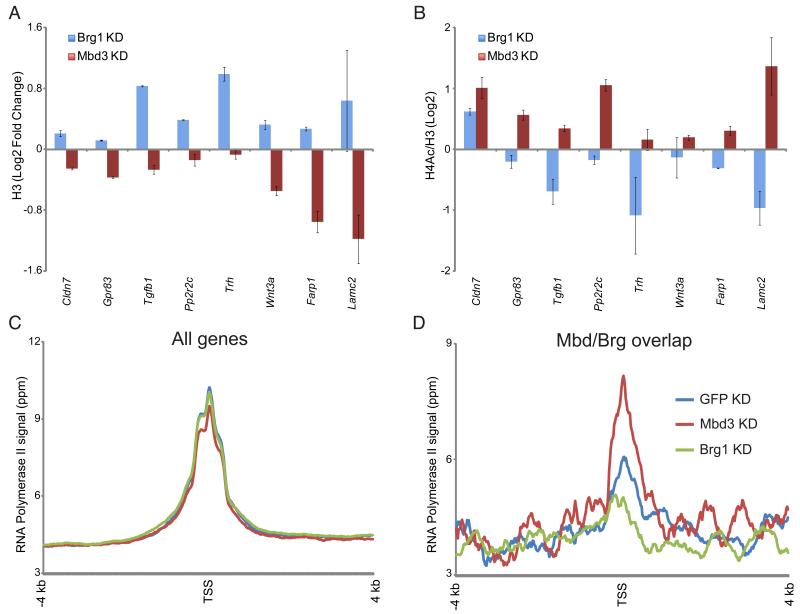
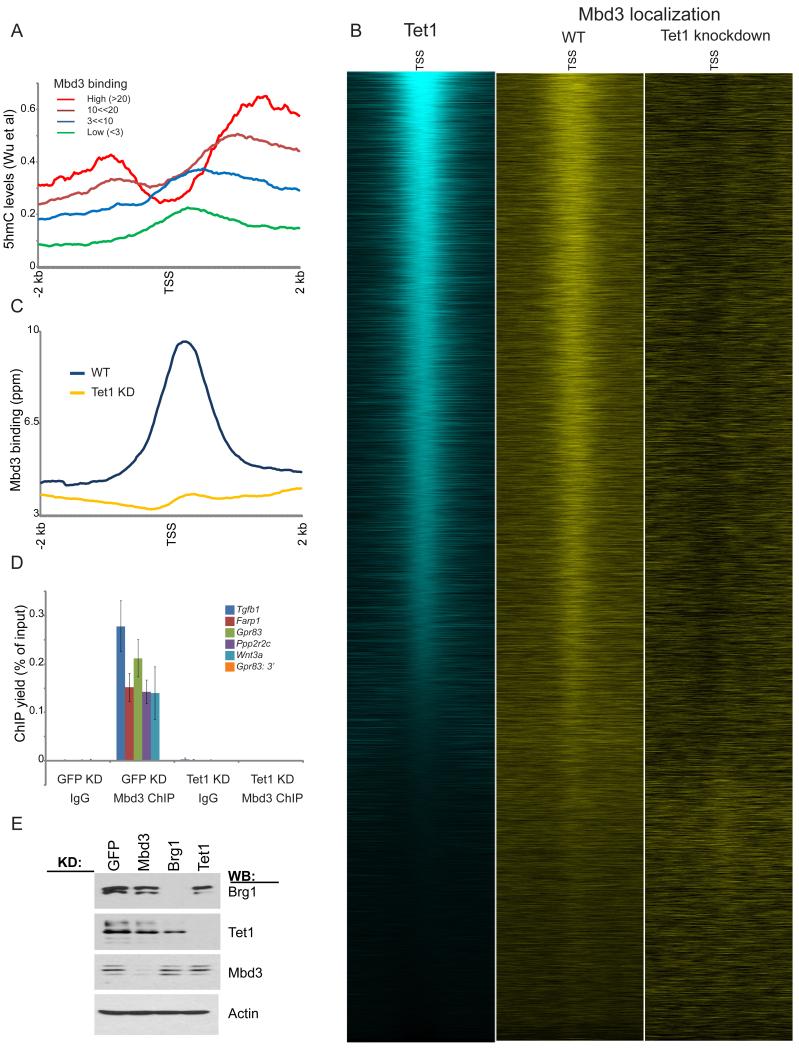
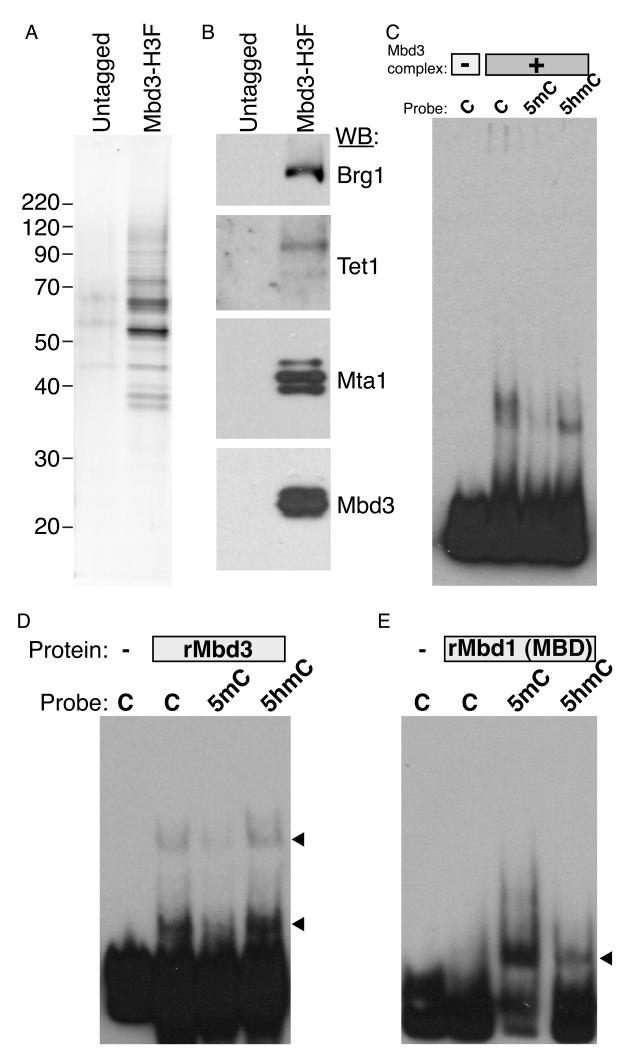
Numerous chromatin regulators are required for embryonic stem (ES) cell self-renewal and pluripotency, but few have been studied in detail. Here, we examine the roles of several chromatin regulators whose loss affects the pluripotent state of ES cells. We find that Mbd3 and Brg1 antagonistically regulate a common set of genes by regulating promoter nucleosome occupancy. Furthermore, both Mbd3 and Brg1 play key roles in the biology of 5-hydroxymethylcytosine (5hmC): Mbd3 colocalizes with Tet1 and 5hmC in vivo, Mbd3 knockdown preferentially affects expression of 5hmC-marked genes, Mbd3 localization is Tet1-dependent, and Mbd3 preferentially binds to 5hmC relative to 5-methylcytosine in vitro. Finally, both Mbd3 and Brg1 are themselves required for normal levels of 5hmC in vivo. Together, our results identify an effector for 5hmC, and reveal that control of gene expression by antagonistic chromatin regulators is a surprisingly common regulatory strategy in ES cells.


Figures

Figure 1
Figure 1. Antagonistic effects of Brg1 and Mbd3 on gene expression in mES cells
(A) Gene expression data for single and double knockdowns of Brg1, Mbd3, Ash2l, Suz12, p400, and Tip60. Heatmap shows pairwise Pearson correlation coefficients for the 21 datasets. Four major clusters emerge, roughly corresponding to Brg1, Mbd3, Ash2l/Suz12, and Tip60/p400. (B) Principal Component Analysis. Genes significantly misregulated (adjusted p-value < 0.01) in any data set from (A) were subjected to principal component analysis. Shown are individual data sets plotted along three most prominent principal components, which account for 87% of the total variance in gene expression. (C) Mbd3 and Brg1 antagonistically regulate a common set of genes. Unsupervised clustering of genes misregulated in both the Mbd3 KD and Brg1 KD datasets (adjusted p-value < 0.05). Clustering was performed on data sets containing either Mbd3 KD or Brg1 KD (or both), as well as the Tip60, p400, Suz12 and Ash2l single KD datasets for contrast. (D) Genes regulated by both Mbd3 and Brg1 tend to be moderately to highly expressed. Shown are mRNA abundance distributions (expressed as log2 of microarray probe intensity) for all genes, and for genes regulated by either or both Mbd3 and Brg1. See also Figure S1, Table S1 and Table S2.
Figure 2
Figure 2. Genome-wide localization of Mbd3
(A) Mbd3 KD effects on gene expression. Genes are sorted by change in mRNA abundance in Mbd3 KD, shown here in Log2. (B) Mbd3 was mapped across the genome in ES cells by ChIP-Seq. Left panel: Mbd3 mapping data for 4 kb surrounding the transcriptional start sites (TSS) of 17,992 genes for which Mbd3KD gene expression data were available, with heatmap yellow saturating at 20 ppm normalized abundance. Right panel: published data for Brg1 (Ho et al., 2009a). In both panels, genes are sorted as in (A). (C) Mbd3 binds downstream of Brg1. Averaged data for all genes in (B) are shown relative to the TSS. (D) Mbd3 and Brg1 physically associate with antagonistically-regulated genes. Mbd3 and Brg1 data are shown for all genes as in C, or only for genes significantly repressed by Mbd3 and activated by Brg1. (E) Mbd3 and Brg1 physically associate. Western blots for Brg1 following immunoprecipitation with the indicated antibodies. (F) Brg1 is required for Mbd3 localization. Mbd3 was mapped genome-wide in Brg1 KD cells, and data for all genes are averaged and plotted as in (C). See also Figure S2, Figure S3, and Figure S4.
Figure 3
Figure 3. Mbd3 directly regulates Polycomb target genes
(A) Mbd3 binding at Polycomb target genes. For 34 mapped factors with thresholded binding defined in (Kim et al., 2010), Mbd3 binding levels (mean ChIP signal for 1 kb centered on the +200 position) were calculated for bound and unbound subsets of genes. Genes annotated as unbound by all 34 factors were removed from this analysis. Factors are sorted according to the relative Mbd3 binding at factor targets relative to nontargets. (B) Mbd3 binding at three ES cell “modules.” Average Mbd3 binding for all genes, and for the three modules defined in (Kim et al., 2010), is plotted relative to the TSS. (C) Mbd3 binding at Polycomb targets and non-targets. For various Polycomb-related marks, averaged Mbd3 profile is shown for bound and unbound genes. (D) Mbd3 binds preferentially to high-CpG promoters. Mbd3 binding data are averaged for high, intermediate, and low CpG (HCP, ICP, and LCP) promoters, as defined in (Weber et al., 2007). (E) Mbd3 KD affects Polycomb targets. Clustered mRNA data for KD of Suz12, Ash2l, Mbd3, or Brg1, and assorted double knockdowns. Genes significantly misregulated in any of the included datasets are shown. (F) Scatterplot of Mbd3 KD gene expression vs. Ash2l KD and Suz12 KD. Only genes showing significant misregulation in Mbd3 KD are shown. See also Figure S3 and Figure S5.
Figure 4
Figure 4. Mbd3 and Brg1 regulate chromatin structure and transcription initiation at target genes
(A) H3 occupancy at Mbd3/Brg1 targets. H3 occupancy is plotted for control KD, Mbd3 KD, and Brg1 KD. (B) H4 acetylation at Mbd3/Brg1 targets. As in (A), for H4 acetylation. Data are normalized to nucleosome occupancy (H3 ChIP). (C) Genome-wide RNA Polymerase II (Pol II) mapping. Average TSS-aligned profiles of Pol II occupancy is shown for all genes for control, Brg1 KD, and Mbd3 KD cells. (D) Pol II levels at the 5′ end correlate with mRNA abundance changes in Brg1 and Mbd3 KDs. As in (C), but only for genes repressed by Mbd3 and activated by Brg1.
Figure 5
Figure 5. Mbd3 associates with hydroxymethylated regions of the genome
(A) Mbd3-bound genes are associated with high levels of hydroxymethylation. Average hydroxymethylation data from (Wu et al., 2011a) are averaged for genes with the indicated levels of Mbd3 binding. (B) Mbd3 colocalizes with Tet1. Left panel: Tet1 (Wu et al., 2011b) mapping data are shown for all named genes, sorted by Tet1 binding levels. Middle and right panels: Mbd3 localization is shown for control and Tet1 KD ES cells. (C) Mbd3 binding data for control and Tet1 KD are plotted as in Figures 2C-D. (D) qPCR validation of Mbd3 binding at 6 selected target loci in GFP or Tet1 KD. Shown are mean +/− sem. (E) Knockdowns of Tet1, Brg1, and Mbd3 do not affect protein levels of the other remaining factors. Knockdowns of the various factors were assayed by Western blot, as indicated. See also Figure S5.
Figure 6
Figure 6. Mbd3 directly binds to hydroxymethylated DNA in vitro
(A) Silver stain showing tandem affinity purification from untagged or Mbd3-6His-3XFLAG ES cells. (B) Western Blot of purifications described in (A) for indicated proteins. Mta1 is a component of the Mbd3/NURD complex. Preliminary mass spec results also identified most other known NURD subunits in this purification (not shown). (C) EMSA assay using Mbd3/NURD complex and DNA probes containing unmodified cytosine (C), methylated cytosine (5mC) or hydroxymethylated cytosine (5hmC). (D-E) EMSA assay using recombinant mouse Mbd3 (D) or recombinant Mbd1 methyl-binding domain (E), and various modified probes as in (C). See also Figure S6.
Figure 7
Figure 7. Mbd3 is required for global hydroxymethylation in vivo
(A) Dot blots of 5hmC. Top panel shows positive (5hmC) and negative (5mC) controls for antibody specificity. Bottom panels show dilution series of genomic DNA isolated from the indicated knockdown ES cells. Mbd3 and Brg1 KDs have similar effects to Tet1KD on bulk 5hmC levels. (B) Thin layer chromatography of radioactively end-labeled bases from MspI-digested genomic DNA (Ficz et al., 2011) from the indicated knockdowns. (C) Quantitation of 5hmC levels (normalized to levels of T) measured as in (B) for 5 independent replicate experiments. Columns show mean +/− sem. (D) Tet1 and Mbd3 knockdowns have similar effects on hydroxymethylation of target gene promoters. Hydroxymethylated DNA was isolated by capture of biotin-glucosylated 5hmC-containing DNA fragments (Song et al., 2011), and fold enrichment over input was assessed by qPCR at the indicated loci and expressed as fold change relative to 5hmC levels in control (EGFP) KD cells. Data represent mean +/− sem. (E) Immunofluorescence imaging of Mbd3 and 5hmC. Immunofluorescence images are pseudocolored blue (DAPI), green (Mbd3), and red (5hmC) for the indicated KDs – top panel shows 5hmC data only, bottom panel shows all 3 colors. See also Figure S7.

Similar articles

Cited by

References

    1. Azuara V, Perry P, Sauer S, Spivakov M, Jorgensen HF, John RM, Gouti M, Casanova M, Warnes G, Merkenschlager M, et al. Chromatin signatures of pluripotent cell lines. Nat Cell Biol. 2006;8:532–538. - PubMed
    1. Barski A, Jothi R, Cuddapah S, Cui K, Roh TY, Schones DE, Zhao K. Chromatin poises miRNA- and protein-coding genes for expression. Genome Res. 2009;19:1742–1751. - PMC - PubMed
    1. Bernstein BE, Mikkelsen TS, Xie X, Kamal M, Huebert DJ, Cuff J, Fry B, Meissner A, Wernig M, Plath K, et al. A bivalent chromatin structure marks key developmental genes in embryonic stem cells. Cell. 2006;125:315–326. - PubMed
    1. Bhutani N, Burns DM, Blau HM. DNA demethylation dynamics. Cell. 2011;146:866–872. - PMC - PubMed
    1. Boyer LA, Plath K, Zeitlinger J, Brambrink T, Medeiros LA, Lee TI, Levine SS, Wernig M, Tajonar A, Ray MK, et al. Polycomb complexes repress developmental regulators in murine embryonic stem cells. Nature. 2006;441:349–353. - PubMed

Publication types

MeSH terms