The acidic transcription activator Gcn4 binds the mediator subunit Gal11/Med15 using a simple protein interface forming a fuzzy complex
- PMID: 22195967
- PMCID: PMC3246216
- DOI: 10.1016/j.molcel.2011.11.008
The acidic transcription activator Gcn4 binds the mediator subunit Gal11/Med15 using a simple protein interface forming a fuzzy complex
Abstract
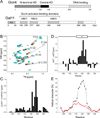
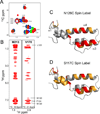
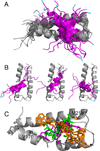
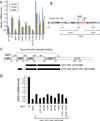
The structural basis for binding of the acidic transcription activator Gcn4 and one activator-binding domain of the Mediator subunit Gal11/Med15 was examined by NMR. Gal11 activator-binding domain 1 has a four-helix fold with a small shallow hydrophobic cleft at its center. In the bound complex, eight residues of Gcn4 adopt a helical conformation, allowing three Gcn4 aromatic/aliphatic residues to insert into the Gal11 cleft. The protein-protein interface is dynamic and surprisingly simple, involving only hydrophobic interactions. This allows Gcn4 to bind Gal11 in multiple conformations and orientations, an example of a "fuzzy" complex, where the Gcn4-Gal11 interface cannot be described by a single conformation. Gcn4 uses a similar mechanism to bind two other unrelated activator-binding domains. Functional studies in yeast show the importance of residues at the protein interface, define the minimal requirements for a functional activator, and suggest a mechanism by which activators bind to multiple unrelated targets.
Copyright © 2011 Elsevier Inc. All rights reserved.
Figures


Similar articles
-
Mechanism of Mediator recruitment by tandem Gcn4 activation domains and three Gal11 activator-binding domains.Mol Cell Biol. 2010 May;30(10):2376-90. doi: 10.1128/MCB.01046-09. Epub 2010 Mar 22. Mol Cell Biol. 2010. PMID: 20308326 Free PMC article.
-
A sequence-specific transcription activator motif and powerful synthetic variants that bind Mediator using a fuzzy protein interface.Proc Natl Acad Sci U S A. 2014 Aug 26;111(34):E3506-13. doi: 10.1073/pnas.1412088111. Epub 2014 Aug 13. Proc Natl Acad Sci U S A. 2014. PMID: 25122681 Free PMC article.
-
Activator Gcn4 employs multiple segments of Med15/Gal11, including the KIX domain, to recruit mediator to target genes in vivo.J Biol Chem. 2010 Jan 22;285(4):2438-55. doi: 10.1074/jbc.M109.071589. Epub 2009 Nov 23. J Biol Chem. 2010. PMID: 19940160 Free PMC article.
-
Mediator subunit Med15 dictates the conserved "fuzzy" binding mechanism of yeast transcription activators Gal4 and Gcn4.Nat Commun. 2021 Apr 13;12(1):2220. doi: 10.1038/s41467-021-22441-4. Nat Commun. 2021. PMID: 33850123 Free PMC article.
-
Med15: Glutamine-Rich Mediator Subunit with Potential for Plasticity.Trends Biochem Sci. 2019 Sep;44(9):737-751. doi: 10.1016/j.tibs.2019.03.008. Epub 2019 Apr 27. Trends Biochem Sci. 2019. PMID: 31036407 Review.
Cited by
-
The Mediator complex of Caenorhabditis elegans: insights into the developmental and physiological roles of a conserved transcriptional coregulator.Nucleic Acids Res. 2015 Feb 27;43(4):2442-53. doi: 10.1093/nar/gkv037. Epub 2015 Jan 29. Nucleic Acids Res. 2015. PMID: 25634893 Free PMC article. Review.
-
Adaptation of the bound intrinsically disordered protein YAP to mutations at the YAP:TEAD interface.Protein Sci. 2018 Oct;27(10):1810-1820. doi: 10.1002/pro.3493. Protein Sci. 2018. PMID: 30058229 Free PMC article.
-
Subunit architecture and functional modular rearrangements of the transcriptional mediator complex.Cell. 2014 Jun 5;157(6):1430-1444. doi: 10.1016/j.cell.2014.05.015. Epub 2014 May 29. Cell. 2014. PMID: 24882805 Free PMC article.
-
Direct prediction of intermolecular interactions driven by disordered regions.bioRxiv [Preprint]. 2024 Jun 3:2024.06.03.597104. doi: 10.1101/2024.06.03.597104. bioRxiv. 2024. PMID: 38895487 Free PMC article. Preprint.
-
Candida albicans Swi/Snf and Mediator Complexes Differentially Regulate Mrr1-Induced MDR1 Expression and Fluconazole Resistance.Antimicrob Agents Chemother. 2017 Oct 24;61(11):e01344-17. doi: 10.1128/AAC.01344-17. Print 2017 Nov. Antimicrob Agents Chemother. 2017. PMID: 28807921 Free PMC article.
References
-
- Brown CE, Howe L, Sousa K, Alley SC, Carrozza MJ, Tan S, Workman JL. Recruitment of HAT complexes by direct activator interactions with the ATM-related Tra1 subunit. Science. 2001;292:2333–2337. - PubMed
-
- Brunger AT, Adams PD, Clore GM, DeLano WL, Gros P, Grosse-Kunstleve RW, Jiang JS, Kuszewski J, Nilges M, Pannu NS, et al. Crystallography & NMR system: A new software suite for macromolecular structure determination. Acta Crystallogr D Biol Crystallogr. 1998;54(Pt 5):905–921. - PubMed
-
- Campbell AP, Sykes BD. The two-dimensional transferred nuclear Overhauser effect: theory and practice. Annu Rev Biophys Biomol Struct. 1993;22:99–122. - PubMed
Publication types
MeSH terms
Substances
Associated data
- Actions
Grants and funding
LinkOut - more resources
Full Text Sources
Other Literature Sources
Molecular Biology Databases

