Inhibition of MTOR disrupts autophagic flux in podocytes
- PMID: 22193387
- PMCID: PMC3294311
- DOI: 10.1681/ASN.2011070690
Inhibition of MTOR disrupts autophagic flux in podocytes
Abstract
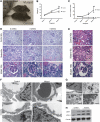
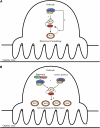
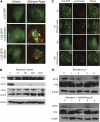
Inhibitors of the mammalian target of rapamycin (MTOR) belong to a family of drugs with potent immunosuppressive, antiangiogenic, and antiproliferative properties. De novo or worsening proteinuria can occur during treatment with these agents, but the mechanism by which this occurs is unknown. We generated and characterized mice carrying a podocyte-selective knockout of the Mtor gene. Although Mtor was dispensable in developing podocytes, these mice developed proteinuria at 3 weeks and end stage renal failure by 5 weeks after birth. Podocytes from these mice exhibited an accumulation of the autophagosome marker LC3 (rat microtubule-associated protein 1 light chain 3), autophagosomes, autophagolysosomal vesicles, and damaged mitochondria. Similarly, human podocytes treated with the MTOR inhibitor rapamycin accumulated autophagosomes and autophagolysosomes. Taken together, these results suggest that disruption of the autophagic pathway may play a role in the pathogenesis of proteinuria in patients treated with MTOR inhibitors.
Figures


Similar articles
-
Advanced glycation end-products suppress autophagic flux in podocytes by activating mammalian target of rapamycin and inhibiting nuclear translocation of transcription factor EB.J Pathol. 2018 Jun;245(2):235-248. doi: 10.1002/path.5077. Epub 2018 Apr 30. J Pathol. 2018. PMID: 29570219 Free PMC article.
-
MTOR regulates autophagic flux in the glomerulus.Autophagy. 2012 Apr;8(4):696-8. doi: 10.4161/auto.19386. Epub 2012 Apr 1. Autophagy. 2012. PMID: 22441016
-
Role of mTOR in podocyte function and diabetic nephropathy in humans and mice.J Clin Invest. 2011 Jun;121(6):2197-209. doi: 10.1172/JCI44774. Epub 2011 May 23. J Clin Invest. 2011. PMID: 21606591 Free PMC article.
-
Rapamycin Reduces Podocyte Apoptosis and is Involved in Autophagy and mTOR/ P70S6K/4EBP1 Signaling.Cell Physiol Biochem. 2018;48(2):765-772. doi: 10.1159/000491905. Epub 2018 Jul 19. Cell Physiol Biochem. 2018. PMID: 30025409
-
Mammalian target of rapamycin signaling in the podocyte.Curr Opin Nephrol Hypertens. 2012 May;21(3):251-7. doi: 10.1097/MNH.0b013e3283520f38. Curr Opin Nephrol Hypertens. 2012. PMID: 22388550 Review.
Cited by
-
Renal Toxicities of Targeted Therapies.Target Oncol. 2015 Dec;10(4):487-99. doi: 10.1007/s11523-015-0368-7. Target Oncol. 2015. PMID: 25922090 Review.
-
The Effect of Chinese Traditional Medicine Huaiqihuang (HQH) on the Protection of Nephropathy.Oxid Med Cell Longev. 2020 Jun 16;2020:2153912. doi: 10.1155/2020/2153912. eCollection 2020. Oxid Med Cell Longev. 2020. PMID: 32655761 Free PMC article. Review.
-
Autophagy and metabolic changes in obesity-related chronic kidney disease.Nephrol Dial Transplant. 2013 Nov;28 Suppl 4(Suppl 4):iv29-36. doi: 10.1093/ndt/gft229. Epub 2013 Jul 30. Nephrol Dial Transplant. 2013. PMID: 23901047 Free PMC article. Review.
-
Cell biology of diabetic nephropathy: Roles of endothelial cells, tubulointerstitial cells and podocytes.J Diabetes Investig. 2015 Jan;6(1):3-15. doi: 10.1111/jdi.12255. Epub 2014 Jul 11. J Diabetes Investig. 2015. PMID: 25621126 Free PMC article. Review.
-
Obesity-mediated autophagy insufficiency exacerbates proteinuria-induced tubulointerstitial lesions.J Am Soc Nephrol. 2013 Nov;24(11):1769-81. doi: 10.1681/ASN.2012111080. Epub 2013 Oct 3. J Am Soc Nephrol. 2013. PMID: 24092929 Free PMC article.
References
-
- Jacinto E, Loewith R, Schmidt A, Lin S, Rüegg MA, Hall A, Hall MN: Mammalian TOR complex 2 controls the actin cytoskeleton and is rapamycin insensitive. Nat Cell Biol 6: 1122–1128, 2004 - PubMed
-
- Guertin DA, Sabatini DM: The pharmacology of mTOR inhibition. Sci Signal 2: pe24, 2009 - PubMed
-
- Sarbassov DD, Ali SM, Sengupta S, Sheen JH, Hsu PP, Bagley AF, Markhard AL, Sabatini DM: Prolonged rapamycin treatment inhibits mTORC2 assembly and Akt/PKB. Mol Cell 22: 159–168, 2006 - PubMed
Publication types
MeSH terms
Substances
Grants and funding
LinkOut - more resources
Full Text Sources
Other Literature Sources
Molecular Biology Databases
Research Materials
Miscellaneous

