Global landscape of HIV-human protein complexes
- PMID: 22190034
- PMCID: PMC3310911
- DOI: 10.1038/nature10719
Global landscape of HIV-human protein complexes
Abstract
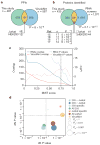
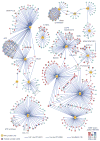
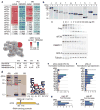
Human immunodeficiency virus (HIV) has a small genome and therefore relies heavily on the host cellular machinery to replicate. Identifying which host proteins and complexes come into physical contact with the viral proteins is crucial for a comprehensive understanding of how HIV rewires the host's cellular machinery during the course of infection. Here we report the use of affinity tagging and purification mass spectrometry to determine systematically the physical interactions of all 18 HIV-1 proteins and polyproteins with host proteins in two different human cell lines (HEK293 and Jurkat). Using a quantitative scoring system that we call MiST, we identified with high confidence 497 HIV-human protein-protein interactions involving 435 individual human proteins, with ∼40% of the interactions being identified in both cell types. We found that the host proteins hijacked by HIV, especially those found interacting in both cell types, are highly conserved across primates. We uncovered a number of host complexes targeted by viral proteins, including the finding that HIV protease cleaves eIF3d, a subunit of eukaryotic translation initiation factor 3. This host protein is one of eleven identified in this analysis that act to inhibit HIV replication. This data set facilitates a more comprehensive and detailed understanding of how the host machinery is manipulated during the course of HIV infection.
Conflict of interest statement
The authors declare no competing financial interests.
Figures


Comment in
-
HIV: Tagged for destruction.Nat Rev Microbiol. 2012 Jan 16;10(2):81. doi: 10.1038/nrmicro2739. Nat Rev Microbiol. 2012. PMID: 22245926 No abstract available.
Similar articles
-
An integrated map of HIV-human protein complexes that facilitate viral infection.PLoS One. 2014 May 9;9(5):e96687. doi: 10.1371/journal.pone.0096687. eCollection 2014. PLoS One. 2014. PMID: 24817247 Free PMC article.
-
Purification and characterization of HIV-human protein complexes.Methods. 2011 Jan;53(1):13-9. doi: 10.1016/j.ymeth.2010.08.007. Epub 2010 Aug 12. Methods. 2011. PMID: 20708689 Free PMC article. Review.
-
Quantitative Temporal Viromics of an Inducible HIV-1 Model Yields Insight to Global Host Targets and Phospho-Dynamics Associated with Protein Vpr.Mol Cell Proteomics. 2017 Aug;16(8):1447-1461. doi: 10.1074/mcp.M116.066019. Epub 2017 Jun 12. Mol Cell Proteomics. 2017. PMID: 28606917 Free PMC article.
-
Vif hijacks CBF-β to degrade APOBEC3G and promote HIV-1 infection.Nature. 2011 Dec 21;481(7381):371-5. doi: 10.1038/nature10693. Nature. 2011. PMID: 22190037 Free PMC article.
-
Making Sense of Multifunctional Proteins: Human Immunodeficiency Virus Type 1 Accessory and Regulatory Proteins and Connections to Transcription.Annu Rev Virol. 2017 Sep 29;4(1):241-260. doi: 10.1146/annurev-virology-101416-041654. Annu Rev Virol. 2017. PMID: 28961413 Free PMC article. Review.
Cited by
-
Viral-Host Interactome Analysis Reveals Chicken STAU2 Interacts With Non-structural Protein 1 and Promotes the Replication of H5N1 Avian Influenza Virus.Front Immunol. 2021 Apr 21;12:590679. doi: 10.3389/fimmu.2021.590679. eCollection 2021. Front Immunol. 2021. PMID: 33968009 Free PMC article.
-
Global mapping of herpesvirus-host protein complexes reveals a transcription strategy for late genes.Mol Cell. 2015 Jan 22;57(2):349-60. doi: 10.1016/j.molcel.2014.11.026. Epub 2014 Dec 24. Mol Cell. 2015. PMID: 25544563 Free PMC article.
-
HIV: Tagged for destruction.Nat Rev Microbiol. 2012 Jan 16;10(2):81. doi: 10.1038/nrmicro2739. Nat Rev Microbiol. 2012. PMID: 22245926 No abstract available.
-
Molecular dynamics simulations of large macromolecular complexes.Curr Opin Struct Biol. 2015 Apr;31:64-74. doi: 10.1016/j.sbi.2015.03.007. Epub 2015 Apr 4. Curr Opin Struct Biol. 2015. PMID: 25845770 Free PMC article. Review.
-
Differential network biology.Mol Syst Biol. 2012 Jan 17;8:565. doi: 10.1038/msb.2011.99. Mol Syst Biol. 2012. PMID: 22252388 Free PMC article. Review.
References
Publication types
MeSH terms
Substances
Grants and funding
- P50 GM082545/GM/NIGMS NIH HHS/United States
- P41 GM103481/GM/NIGMS NIH HHS/United States
- P41RR001614/RR/NCRR NIH HHS/United States
- P50GM081879/GM/NIGMS NIH HHS/United States
- P50 GM081879/GM/NIGMS NIH HHS/United States
- P50 GM081879-02/GM/NIGMS NIH HHS/United States
- P01 GM073732-05/GM/NIGMS NIH HHS/United States
- P41 RR001081/RR/NCRR NIH HHS/United States
- P50GM082545/GM/NIGMS NIH HHS/United States
- P01 AI090935/AI/NIAID NIH HHS/United States
- U54 RR022220/RR/NCRR NIH HHS/United States
- P01 GM073732/GM/NIGMS NIH HHS/United States
- P50 GM082250-05/GM/NIGMS NIH HHS/United States
- P50 GM082250/GM/NIGMS NIH HHS/United States
- P01 AI090935-02/AI/NIAID NIH HHS/United States
- P41 RR001614/RR/NCRR NIH HHS/United States
LinkOut - more resources
Full Text Sources
Other Literature Sources
Molecular Biology Databases
Miscellaneous

