

Different expression systems for production of recombinant proteins in Saccharomyces cerevisiae
- PMID: 22179756
- PMCID: PMC4128558
- DOI: 10.1002/bit.24409
Different expression systems for production of recombinant proteins in Saccharomyces cerevisiae
Abstract
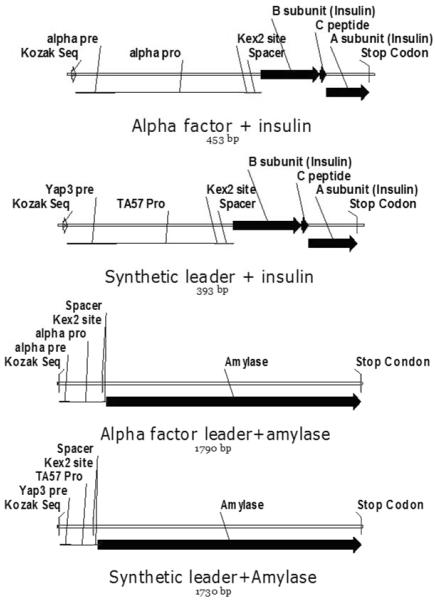
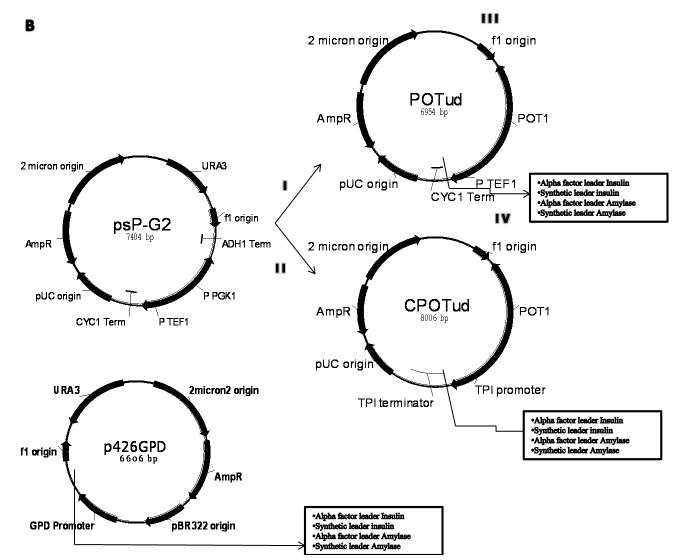
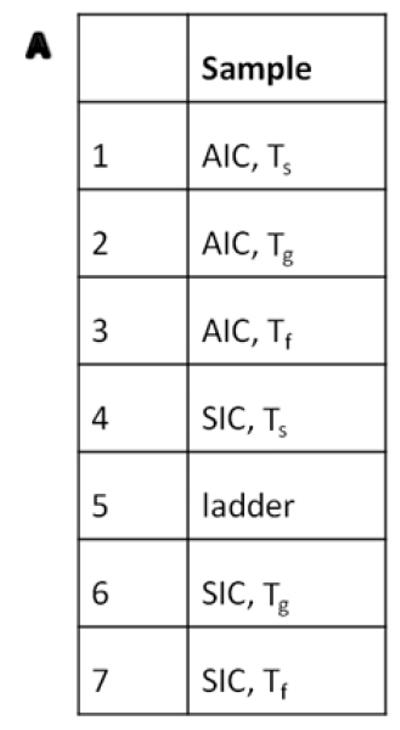
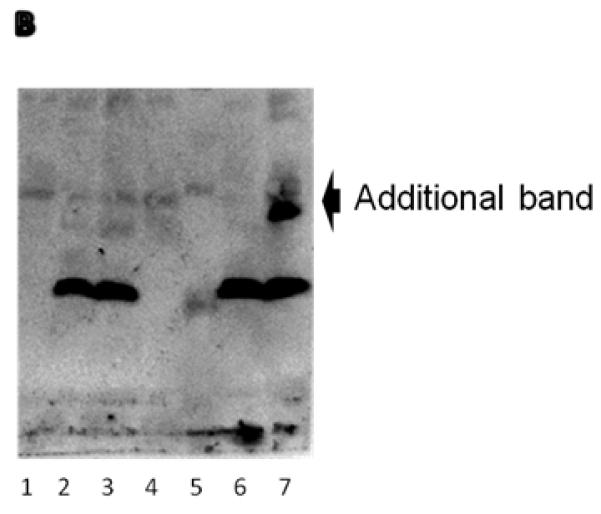
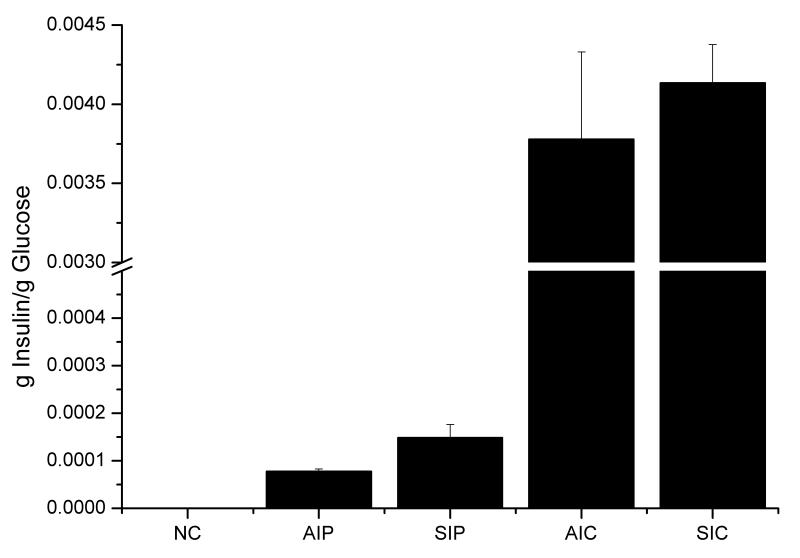
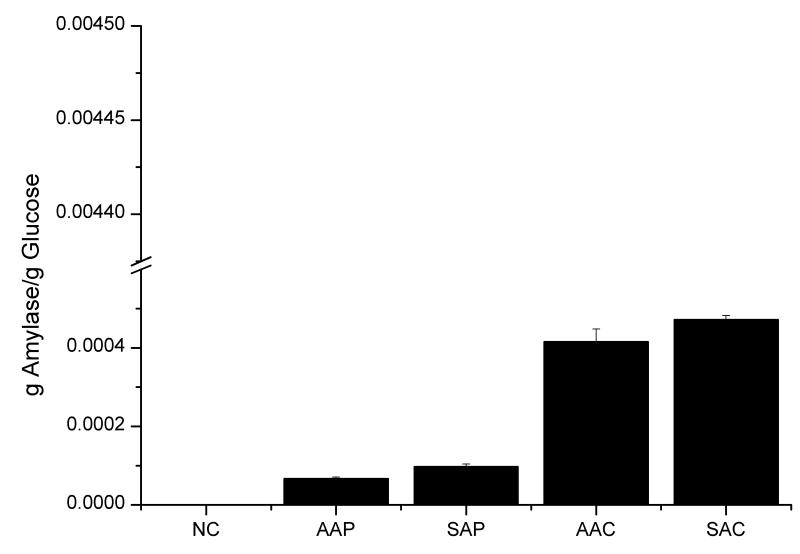
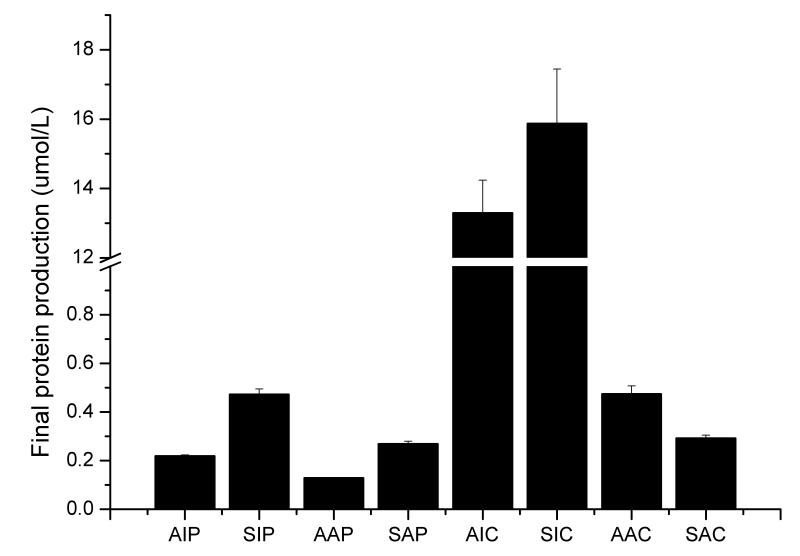
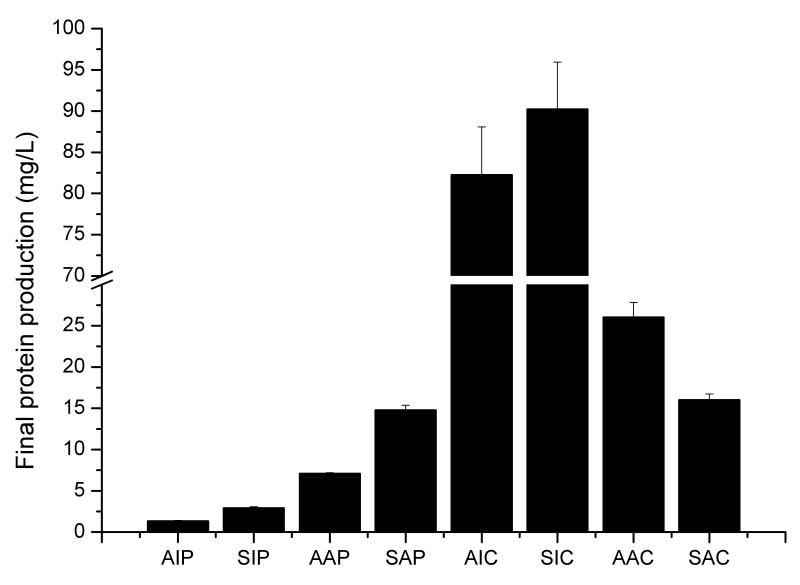
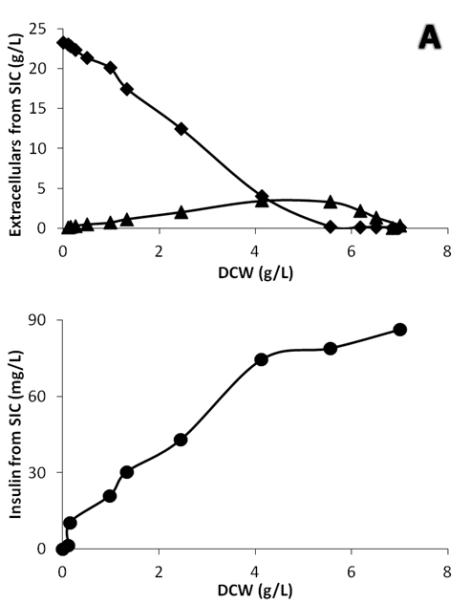
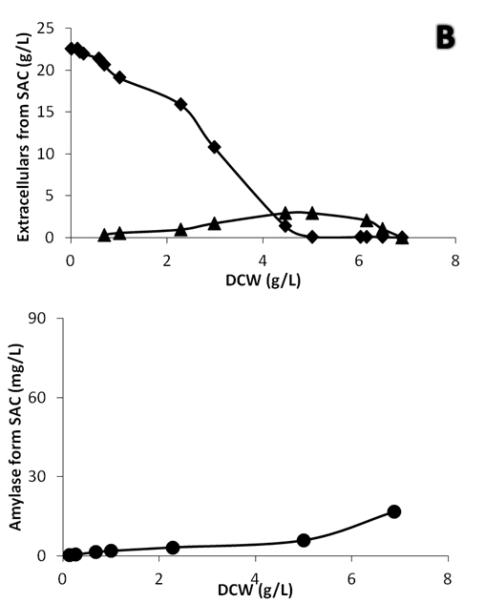
Yeast Saccharomyces cerevisiae has become an attractive cell factory for production of commodity and speciality chemicals and proteins, such as industrial enzymes and pharmaceutical proteins. Here we evaluate most important expression factors for recombinant protein secretion: we chose two different proteins (insulin precursor (IP) and α-amylase), two different expression vectors (POTud plasmid and CPOTud plasmid) and two kinds of leader sequences (the glycosylated alpha factor leader and a synthetic leader with no glycosylation sites). We used IP and α-amylase as representatives of a simple protein and a multi-domain protein, as well as a non-glycosylated protein and a glycosylated protein, respectively. The genes coding for the two recombinant proteins were fused independently with two different leader sequences and were expressed using two different plasmid systems, resulting in eight different strains that were evaluated by batch fermentations. The secretion level (µmol/L) of IP was found to be higher than that of α-amylase for all expression systems and we also found larger variation in IP production for the different vectors. We also found that there is a change in protein production kinetics during the diauxic shift, that is, the IP was produced at higher rate during the glucose uptake phase, whereas amylase was produced at a higher rate in the ethanol uptake phase. For comparison, we also refer to data from another study, (Tyo et al. submitted) in which we used the p426GPD plasmid (standard vector using URA3 as marker gene and pGPD1 as expression promoter). For the IP there is more than 10-fold higher protein production with the CPOTud vector compared with the standard URA3-based vector, and this vector system therefore represent a valuable resource for future studies and optimization of recombinant protein production in yeast.
Copyright © 2011 Wiley Periodicals, Inc.
Figures
Similar articles
-
Expression of human salivary alpha-amylase gene in Saccharomyces cerevisiae and its secretion using the mammalian signal sequence.Gene. 1986;50(1-3):239-45. doi: 10.1016/0378-1119(86)90328-8. Gene. 1986. PMID: 3556324
-
Heat shock response improves heterologous protein secretion in Saccharomyces cerevisiae.Appl Microbiol Biotechnol. 2013 Apr;97(8):3559-68. doi: 10.1007/s00253-012-4596-9. Epub 2012 Dec 4. Appl Microbiol Biotechnol. 2013. PMID: 23208612
-
Co-expression of a Saccharomyces diastaticus glucoamylase-encoding gene and a Bacillus amyloliquefaciens alpha-amylase-encoding gene in Saccharomyces cerevisiae.Gene. 1991 Apr;100:85-93. doi: 10.1016/0378-1119(91)90353-d. Gene. 1991. PMID: 2055483
-
Applications of yeast in biotechnology: protein production and genetic analysis.Curr Opin Biotechnol. 1999 Oct;10(5):422-7. doi: 10.1016/s0958-1669(99)00004-x. Curr Opin Biotechnol. 1999. PMID: 10508632 Review.
-
Plasmid addiction systems: perspectives and applications in biotechnology.Microb Biotechnol. 2010 Nov;3(6):634-57. doi: 10.1111/j.1751-7915.2010.00170.x. Microb Biotechnol. 2010. PMID: 21255361 Free PMC article. Review.
Cited by
-
Engineering Cell Polarization Improves Protein Production in Saccharomyces cerevisiae.Microorganisms. 2022 Oct 11;10(10):2005. doi: 10.3390/microorganisms10102005. Microorganisms. 2022. PMID: 36296281 Free PMC article.
-
Heterologous Production of Antimicrobial Peptides: Notes to Consider.Protein J. 2024 Apr;43(2):129-158. doi: 10.1007/s10930-023-10174-w. Epub 2024 Jan 5. Protein J. 2024. PMID: 38180586
-
Improved secretory expression of lignocellulolytic enzymes in Kluyveromyces marxianus by promoter and signal sequence engineering.Biotechnol Biofuels. 2018 Aug 29;11:235. doi: 10.1186/s13068-018-1232-7. eCollection 2018. Biotechnol Biofuels. 2018. PMID: 30279722 Free PMC article.
-
Engineering the protein secretory pathway of Saccharomyces cerevisiae enables improved protein production.Proc Natl Acad Sci U S A. 2018 Nov 20;115(47):E11025-E11032. doi: 10.1073/pnas.1809921115. Epub 2018 Nov 5. Proc Natl Acad Sci U S A. 2018. PMID: 30397111 Free PMC article.
-
Saccharomyces cerevisiae fungemia in a critically ill patient with acute cholangitis and long term probiotic use.Med Mycol Case Rep. 2018 Nov 12;23:23-25. doi: 10.1016/j.mmcr.2018.11.003. eCollection 2019 Mar. Med Mycol Case Rep. 2018. PMID: 30505677 Free PMC article.
References
-
- Agaphonov M, Romanova N, Choi E, Ter-Avanesyan M. A novel kanamycin/G418 resistance marker for direct selection of transformants in Escherichia coli and different yeast species. Yeast. 2010;27(4):189–195. - PubMed
-
- Aggarwal S. What’s fueling the biotech engine—2009–2010. Nat Biotech. 2010;28(11):1165–1171. - PubMed
-
- Alao J, Olesch J, Sunnerhagen P. Inhibition of type I histone deacetylase increases resistance of checkpoint-deficient cells to genotoxic agents through mitotic delay. Mol Cancer Ther. 2009;8(9):2606–2615. - PubMed
-
- Alexandre H, Ansanay-Galeote V, Dequin S, Blondin B. Global gene expression during short-term ethanol stress in Saccharomyces cerevisiae. FEBS Lett. 2001;498(1):98–103. - PubMed
Publication types
MeSH terms
Substances
Grants and funding
LinkOut - more resources
Full Text Sources
Other Literature Sources
Molecular Biology Databases
