. 2011 Dec 18;13(2):181-7.
doi: 10.1038/ni.2193.

The thymic epithelial microRNA network elevates the threshold for infection-associated thymic involution via miR-29a mediated suppression of the IFN-α receptor

Affiliations

The thymic epithelial microRNA network elevates the threshold for infection-associated thymic involution via miR-29a mediated suppression of the IFN-α receptor

Aikaterini S Papadopoulou et al. Nat Immunol. .

Abstract

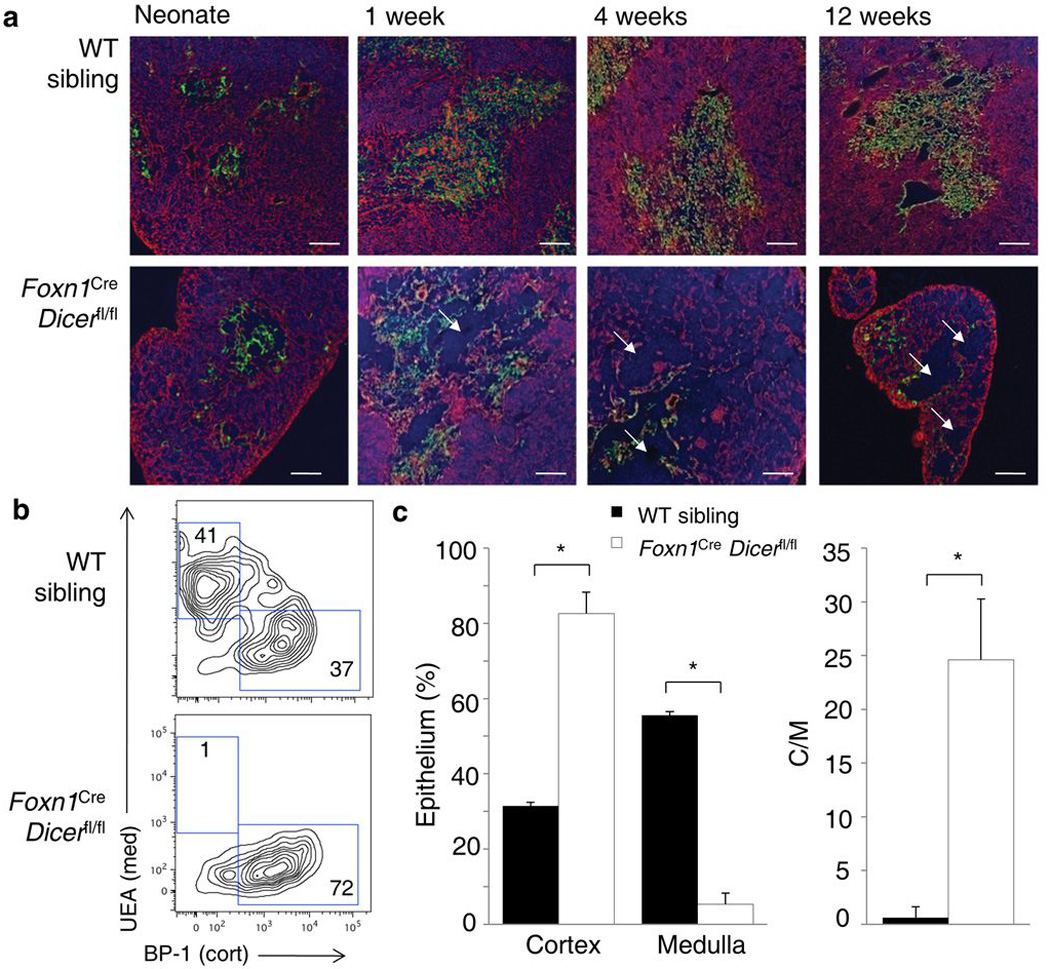
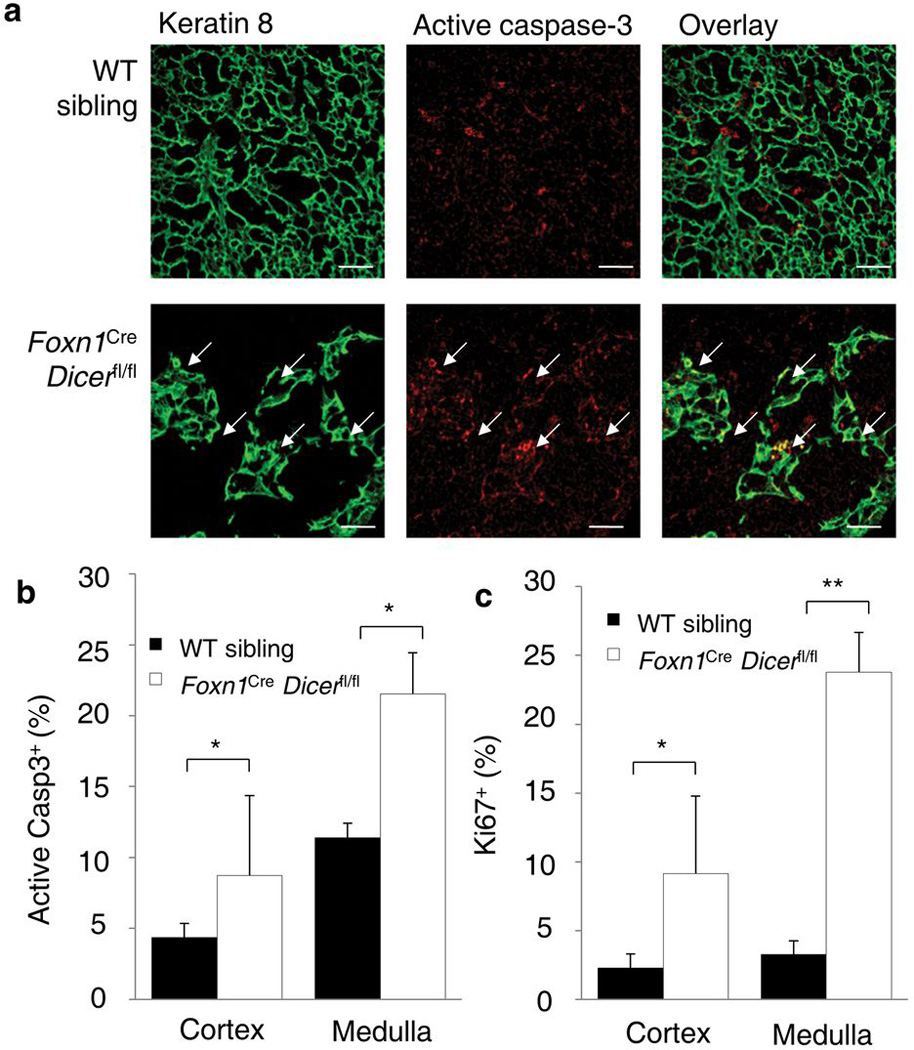
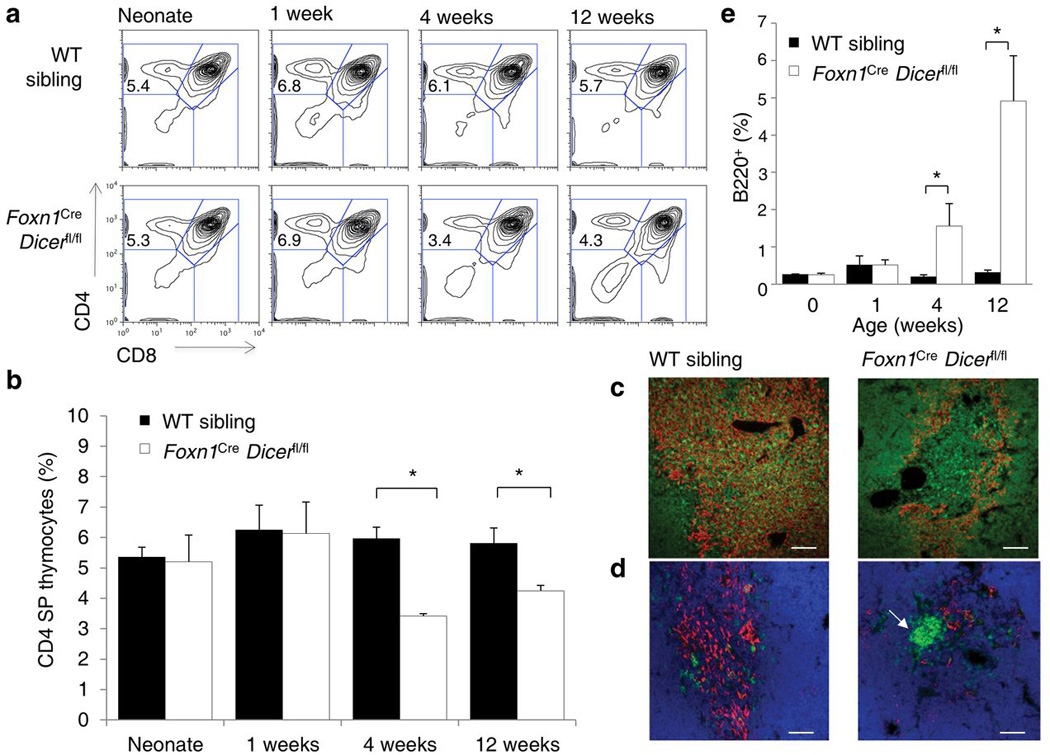
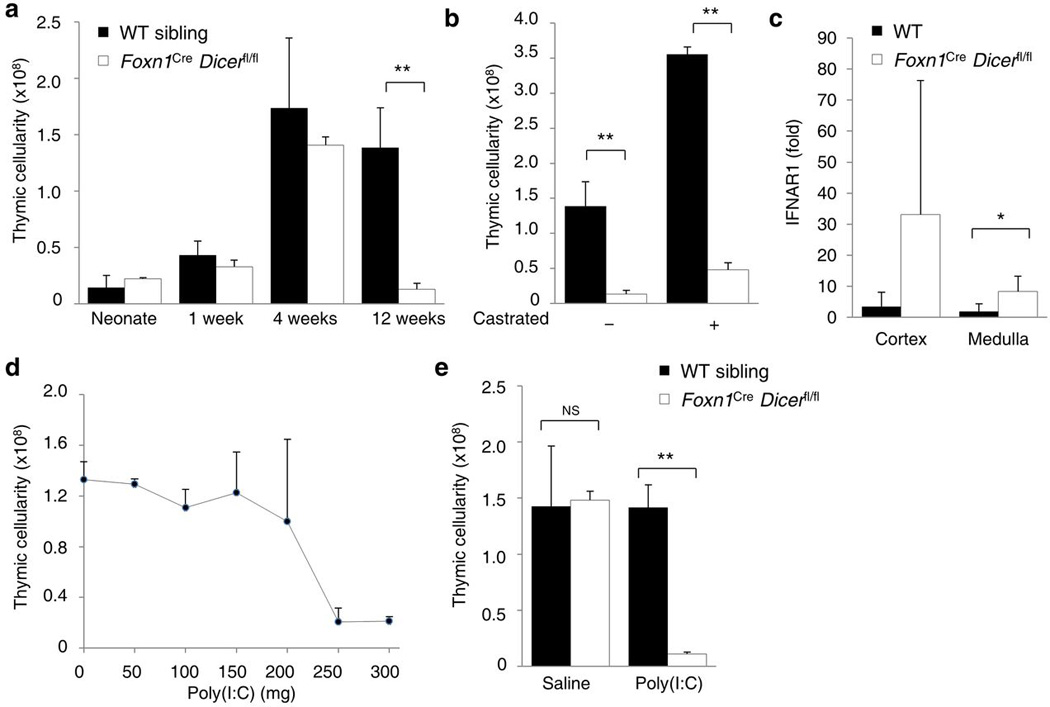
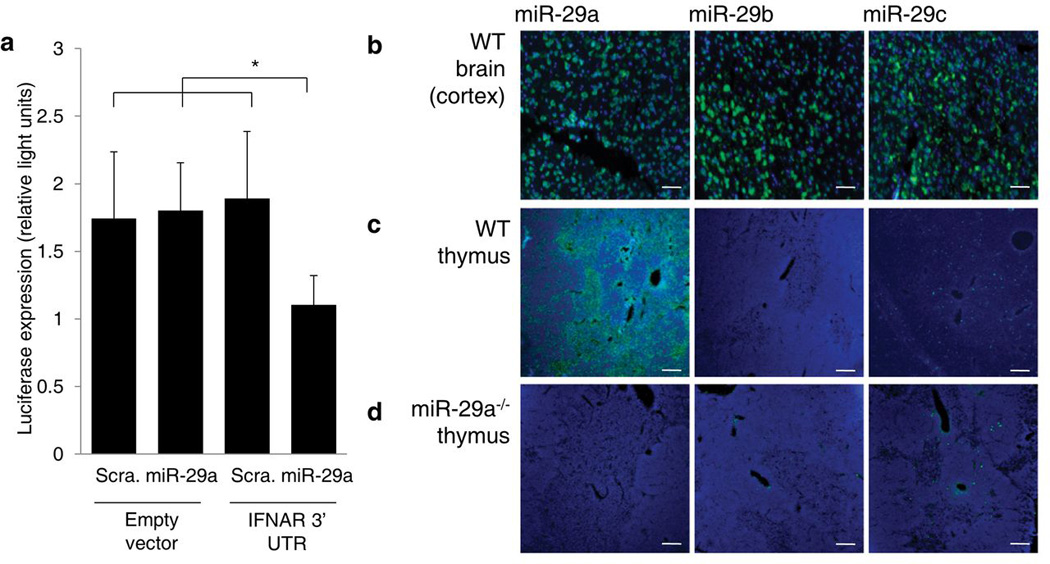
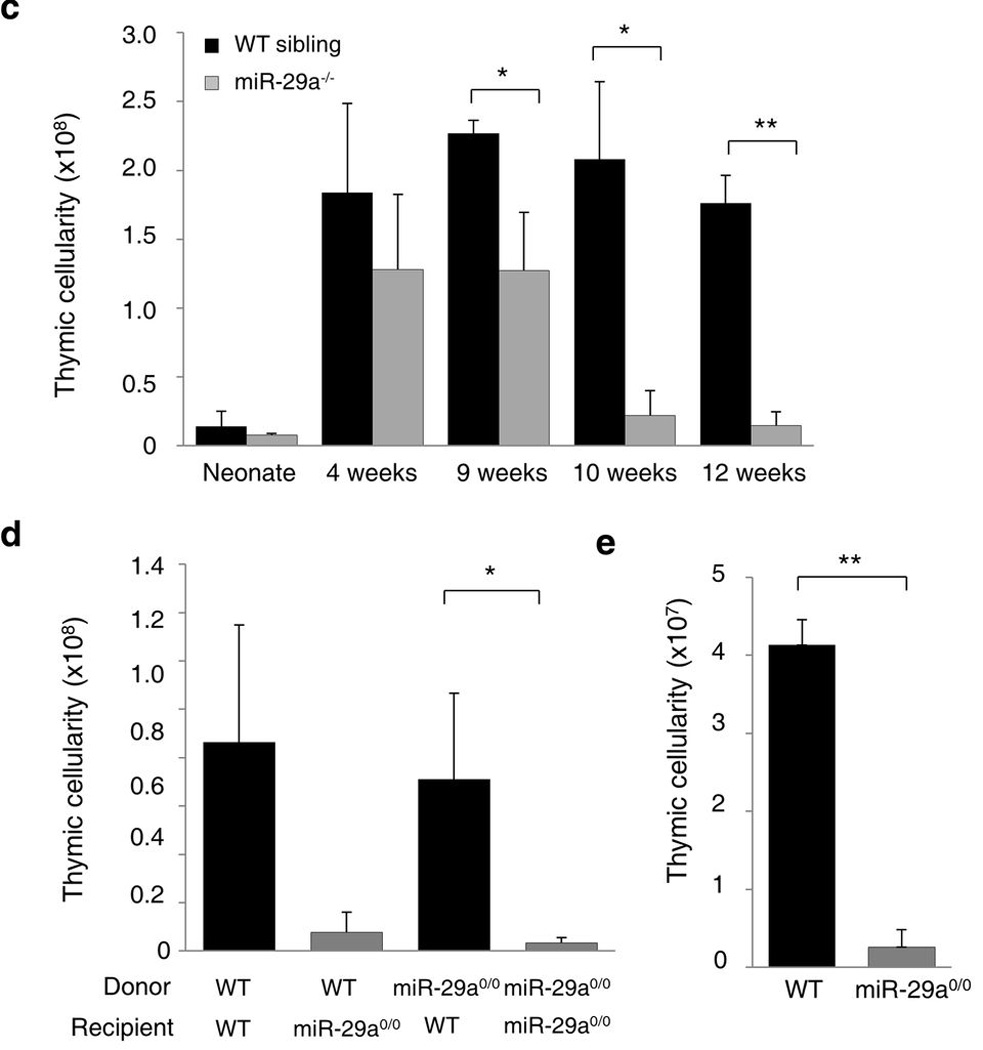
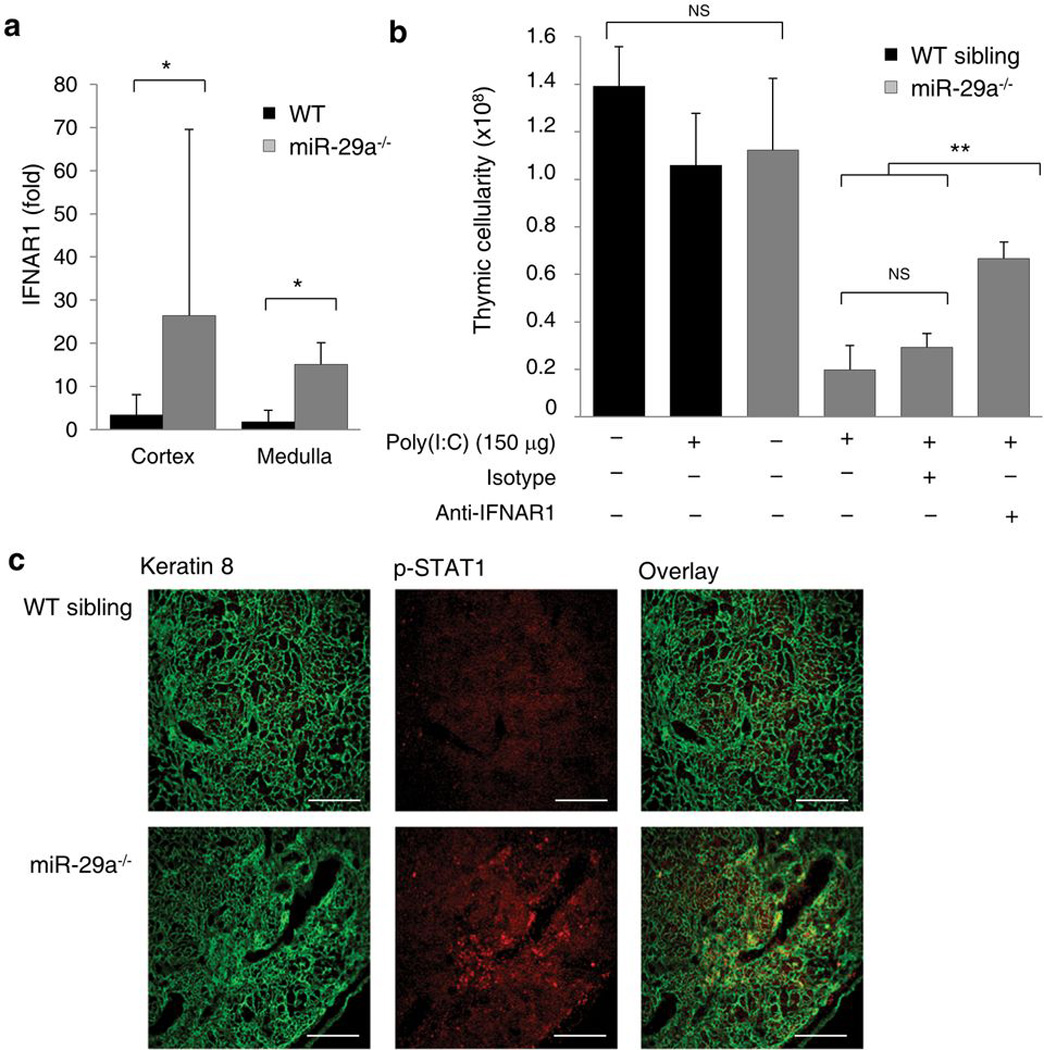
Thymic output is a dynamic process, with high activity at birth punctuated by transient periods of involution during infection. Interferon-α (IFN-α) is a critical molecular mediator of pathogen-induced thymic involution, yet despite the importance of thymic involution, relatively little is known about the molecular integrators that establish sensitivity. Here we found that the microRNA network dependent on the endoribonuclease Dicer, and specifically microRNA miR-29a, was critical for diminishing the sensitivity of the thymic epithelium to simulated infection signals, protecting the thymus against inappropriate involution. In the absence of Dicer or the miR-29a cluster in the thymic epithelium, expression of the IFN-α receptor by the thymic epithelium was higher, which allowed suboptimal signals to trigger rapid loss of thymic cellularity.


Figures

Figure 1
Figure 1. Loss of miRNA in the thymic epithelium results in progressive loss of thymic architecture
(a) Immunofluorescent staining of the thymus of Foxn1Cre Dicerfl/fl mice and wild-type siblings assessed at birth, 1, 4 and 12 weeks of age. Representative pictures from five experiments are shown. Keratin 8 (cortex; red), Keratin 14 (medulla; green) and DAPI (blue). Arrows indicate epithelial voids. Scale bar represents 100µm. (b) Frequencies of cortical (BP-1+UEA) and medullary (BP-1UEA+) epithelium measured by flow cytometry in wild-type and Foxn1Cre Dicerfl/fl thymi and gated on CD45G8.8+ epithelium at 12 weeks of age. Representative profiles of five experiments are shown. (c) Average proportion of cortical and medullary epithelium and the cortical/medullary ratio in mice analyzed as in b (n=5,6). *p< 0.001.
Figure 2
Figure 2. Medullary thymic epithelium exhibits enhanced apoptosis in the absence of miRNA
(a) Immunofluorescent staining of the thymus of Foxn1Cre Dicerfl/fl mice and wild-type siblings assessed at 12 weeks of age. Representative pictures of from five experiments are shown. Keratin 8 (green, left), activated Caspase-3 (red, center) and overlay (yellow, right). Arrows indicate apoptotic epithelial cells. Scale bar represents 50µm. (b) Average proportion of apoptotic cells (activated Caspase-3+ cells) within cortical (BP-1+UEA) and medullary (BP-1UEA+) epithelium, as measured by flow cytometry at 12 weeks of age in wild-type and Foxn1Cre Dicerfl/fl siblings (n=4,5). (c) Average frequency of proliferating cells (Ki67+ cells) among cortical (BP-1+UEA) and medullary (BP-1UEA+) epithelium, as measured by flow cytometry at 12 weeks of age in wildtype and Foxn1Cre Dicerfl/fl siblings (n=4,5). *p< 0.05, **p< 0.001.
Figure 3
Figure 3. Progressive decay in thymocyte differentiation associated with the presence of epithelial voids in Dicer-deficient mice
(a) Frequencies of CD4 SP thymocytes measured by flow cytometry in wild-type and Foxn1Cre Dicerfl/fl thymi. Representative CD4-CD8 thymocyte profiles from six experiments are shown. (b) Average CD4 single positive thymocyte frequency in mice analyzed as in a (n=2–5/group). (c) Immunofluorescent staining of the thymus of Foxn1Cre Dicerfl/fl mice and wild-type siblings assessed at 4 weeks of age. Representative pictures of from three experiments are shown. Keratin 14 (red) and CD4 (green). Scale bar represents 100µm. (d) Immunofluorescent staining of the thymus of Foxn1Cre Dicerfl/fl mice and wild-type siblings assessed at 4 weeks of age. Representative pictures of from three experiments are shown. Keratin 14 (red), CD19 (green) and DAPI (blue). 62% of epithelial voids showed CD19 foci (n=53). Scale bar represents 100µm. (e) Average proportion of B cells found within the thymus as measured by flow cytometry of wild-type and Foxn1Cre Dicerfl/fl siblings (n=2–5/group). *p< 0.05.
Figure 4
Figure 4. Thymic epithelial defects in the miRNA network result in hyper-sensitivity to IFN-α and premature thymic involution
(a) Thymic cellularity of wild-type and Foxn1Cre Dicerfl/fl mice assessed at birth, 1, 4 and 12 weeks of age (n=3–17/group). (b) Thymic cellularity in wild-type and Foxn1Cre Dicerfl/fl surgically castrated at 7 weeks of age and assessed at 12 weeks (n=3–7/group). (c) Fold change of IFNAR1 mRNA expression in cortical (BP-1+UEA) and medullary (BP-1UEA+) thymic epithelium from wild-type and Foxn1Cre Dicerfl/fl mice at 6–8 weeks (n=5,4). Fold-change is relative to the average of wild-type cortex values. (d) Thymic cellularity in wild-type mice injected with 0–300µg of poly(I:C) exposure effect on thymic cellularity at 4 weeks of age (n=6,3,8,9,6,7,5/group). (e) Thymic cellularity of wild-type and Foxn1Cre Dicerfl/fl mice treated with 150µg dose of poly(I:C) at 4 weeks (n=3–5/group). *p< 0.05, **p< 0.0001.
Figure 5
Figure 5. IFNAR is a direct target of miR-29a
(a) Luciferase expression in HeLa-M cells transfected with empty PsiCheck2 or PsiCheck2 containing the Ifnar1 3’UTR and treated with miR-29a mimic or a scrambled mimic (n=5/group, representative of three independent experiments). *p< 0.05. (b) In situ hybridization for miR-29a, miR-29b and miR-29c in the brain of wild-type. Probe (green) and DAPI (blue). (c) In situ hybridization of thymus of wild-type mice, as in b. (d) In situ hybridization of thymus of miR-29a−/− mice, as in b. Representative pictures from two experiments are shown. Scale bar represents 100µm.
Figure 6
Figure 6. Thymic involution and architecture alterations segregate in miR-29a−/− mice
(a) Immunofluorescent staining of the thymus of wild-type and miR-29a−/− mice assessed at 1, 6 and 10 weeks of age. Representative pictures from five experiments are shown. UEA (red), Keratin 14 (green). Scale bar represents 100µm. (b) Immunofluorescent staining of the thymus as in a. Keratin 14 (red) and G8.8 (EPCAM; green). (c) Thymic cellularity of wild-type and miR-29a−/− mice at birth and 4, 9, 10 and 12 weeks of age (n=2–7/group). (d) Thymic cellularity of bone-marrow chimeric mice, indicating the genotypes of the bone-marrow donor and the recipients (n=13,10,11,4). Results pooled from three independent experiments. (e) Thymic cellularity of wild-type mice transplanted with wild-type (n=3) or miR-29a0/0 (n=4) thymi, assessed at 6 weeks post-transplant. *p< 0.05, **p< 0.0001
Figure 7
Figure 7. Thymic epithelial defects in miR-29a result in PAMP hyper-sensitivity and inappropriate thymic involution
(a) Fold change of IFNAR1 mRNA expression in cortical (BP-1+UEA) and medullary (BP-1UEA+) thymic epithelium from wild-type and miR-29a−/− mice at 6–8 weeks (n=5,3). Fold-change is relative to the average of wild-type cortex values. (b) Thymic cellularity of 4 week-old wildtype and miR-29a−/− mice treated with 150µg dose of poly(I:C) at 4 weeks, with or without coinjection of anti-IFNAR1 antibody or isotype control (n=3–10/group). (c) Immunofluorescent staining of the thymus of wild-type and miR-29a−/− mice assessed at 12 weeks of age. Representative pictures of two experiments are shown. Keratin 8 (green, left), phosphorylated STAT1 (red, centre) and colocalization (yellow, right). Scale bar represents 100µm. *p< 0.05, **p< 0.0001

Similar articles

Cited by

References

    1. Miller JF. Immunological function of the thymus. Lancet. 1961;2:748–749. - PubMed
    1. Itoh M, et al. Thymus and autoimmunity: production of CD25+CD4+ naturally anergic and suppressive T cells as a key function of the thymus in maintaining immunologic self-tolerance. J Immunol. 1999;162:5317–5326. - PubMed
    1. King CC, et al. Viral infection of the thymus. J Virol. 1992;66:3155–3160. - PMC - PubMed
    1. Anz D, et al. Activation of melanoma differentiation-associated gene 5 causes rapid involution of the thymus. J Immunol. 2009;182:6044–6050. - PubMed
    1. Aronson M. Hypothesis: involution of the thymus with aging--programmed and beneficial. Thymus. 1991;18:7–13. - PubMed

Publication types

LinkOut - more resources