Selective roles for cAMP response element-binding protein binding protein and p300 protein as coregulators for androgen-regulated gene expression in advanced prostate cancer cells
- PMID: 22174411
- PMCID: PMC3281703
- DOI: 10.1074/jbc.M111.300194
Selective roles for cAMP response element-binding protein binding protein and p300 protein as coregulators for androgen-regulated gene expression in advanced prostate cancer cells
Erratum in
- J Biol Chem. 2012 Oct 19;287(43):35985
Abstract
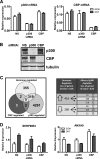
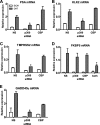
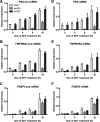
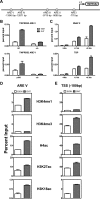
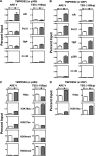
The protein acetyltransferases p300 and cAMP response element-binding protein binding protein (CBP) are homologous, ubiquitously expressed proteins that interact with hundreds of proteins involved in transcriptional regulation and are involved globally as transcriptional coregulators. Although these two proteins acetylate and interact with overlapping sets of proteins, we found that p300 and CBP contribute to androgen-induced regulation of distinct sets of genes in C4-2B prostate cancer cells, a model of advanced prostate cancer. CBP cannot compensate for the loss of p300 to support androgen-induced expression of many genes, such as TMPRSS2 and PSA. Global gene expression analysis indicated that 47% of androgen-regulated genes are p300-dependent in these cells, whereas, surprisingly, only 0.3% of them are CBP-dependent. Chromatin immunoprecipitation analysis after depletion of cellular p300 indicated that p300 is required for androgen-induced acetylation of histones H3 and H4, methylation of histone H3 at Lys-4, and recruitment of TATA box binding protein (TBP) and RNA polymerase II, but not recruitment of the androgen receptor, on the TMPRSS2 gene in response to androgen. Thus, p300 is the dominant coregulator of the CBP/p300 pair for androgen-regulated gene expression in C4-2B cells. p300 is required at an early stage of chromatin remodeling and transcription complex assembly after binding of androgen receptor to the gene but before many critical histone modifications occur.
Figures



Similar articles
-
Histone Acetyltransferases p300 and CBP Coordinate Distinct Chromatin Remodeling Programs in Vascular Smooth Muscle Plasticity.Circulation. 2022 Jun 7;145(23):1720-1737. doi: 10.1161/CIRCULATIONAHA.121.057599. Epub 2022 May 3. Circulation. 2022. PMID: 35502657
-
CBP and p300 histone acetyltransferases contribute to homologous recombination by transcriptionally activating the BRCA1 and RAD51 genes.PLoS One. 2012;7(12):e52810. doi: 10.1371/journal.pone.0052810. Epub 2012 Dec 20. PLoS One. 2012. PMID: 23285190 Free PMC article.
-
Inhibition of the acetyltransferases p300 and CBP reveals a targetable function for p300 in the survival and invasion pathways of prostate cancer cell lines.Mol Cancer Ther. 2011 Sep;10(9):1644-55. doi: 10.1158/1535-7163.MCT-11-0182. Epub 2011 Jun 27. Mol Cancer Ther. 2011. PMID: 21709130
-
CREBBP and p300 lysine acetyl transferases in the DNA damage response.Cell Mol Life Sci. 2018 Apr;75(8):1325-1338. doi: 10.1007/s00018-017-2717-4. Epub 2017 Nov 23. Cell Mol Life Sci. 2018. PMID: 29170789 Free PMC article. Review.
-
Unravelling the Role of P300 and TMPRSS2 in Prostate Cancer: A Literature Review.Int J Mol Sci. 2023 Jul 11;24(14):11299. doi: 10.3390/ijms241411299. Int J Mol Sci. 2023. PMID: 37511059 Free PMC article. Review.
Cited by
-
Neuroendocrine transdifferentiation in human cancer: molecular mechanisms and therapeutic targets.MedComm (2020). 2024 Oct 4;5(10):e761. doi: 10.1002/mco2.761. eCollection 2024 Oct. MedComm (2020). 2024. PMID: 39372390 Free PMC article. Review.
-
AR coactivators, CBP/p300, are critical mediators of DNA repair in prostate cancer.Oncogene. 2024 Oct;43(43):3197-3213. doi: 10.1038/s41388-024-03148-4. Epub 2024 Sep 13. Oncogene. 2024. PMID: 39266679 Free PMC article.
-
Selective p300 degradation via peptide PROTAC: a new therapeutic strategy for advanced prostate cancers.EBioMedicine. 2024 Aug;106:105245. doi: 10.1016/j.ebiom.2024.105245. Epub 2024 Jul 8. EBioMedicine. 2024. PMID: 38981160 Free PMC article. No abstract available.
-
AR coactivators, CBP/p300, are critical mediators of DNA repair in prostate cancer.bioRxiv [Preprint]. 2024 May 7:2024.05.07.592966. doi: 10.1101/2024.05.07.592966. bioRxiv. 2024. Update in: Oncogene. 2024 Oct;43(43):3197-3213. doi: 10.1038/s41388-024-03148-4. PMID: 38766099 Free PMC article. Updated. Preprint.
-
Transcriptional co-activators: emerging roles in signaling pathways and potential therapeutic targets for diseases.Signal Transduct Target Ther. 2023 Nov 13;8(1):427. doi: 10.1038/s41392-023-01651-w. Signal Transduct Target Ther. 2023. PMID: 37953273 Free PMC article. Review.
References
-
- Heinlein C. A., Chang C. (2002) Androgen receptor (AR) coregulators. An overview. Endocr. Rev. 23, 175–200 - PubMed
-
- Lamont K. R., Tindall D. J. (2010) Androgen regulation of gene expression. Adv. Cancer Res. 107, 137–162 - PubMed
-
- Heemers H. V., Tindall D. J. (2005) Androgen receptor coregulatory proteins as potential therapeutic targets in the treatment of prostate cancer. Curr. Cancer Ther. Rev. 1, 175–186
Publication types
MeSH terms
Substances
Associated data
- Actions
Grants and funding
LinkOut - more resources
Full Text Sources
Medical
Research Materials
Miscellaneous

