. 2011 Dec 14;31(50):18492-505.
doi: 10.1523/JNEUROSCI.3219-11.2011.

Constitutive upregulation of chaperone-mediated autophagy in Huntington's disease

Affiliations

Constitutive upregulation of chaperone-mediated autophagy in Huntington's disease

Hiroshi Koga et al. J Neurosci. .

Abstract

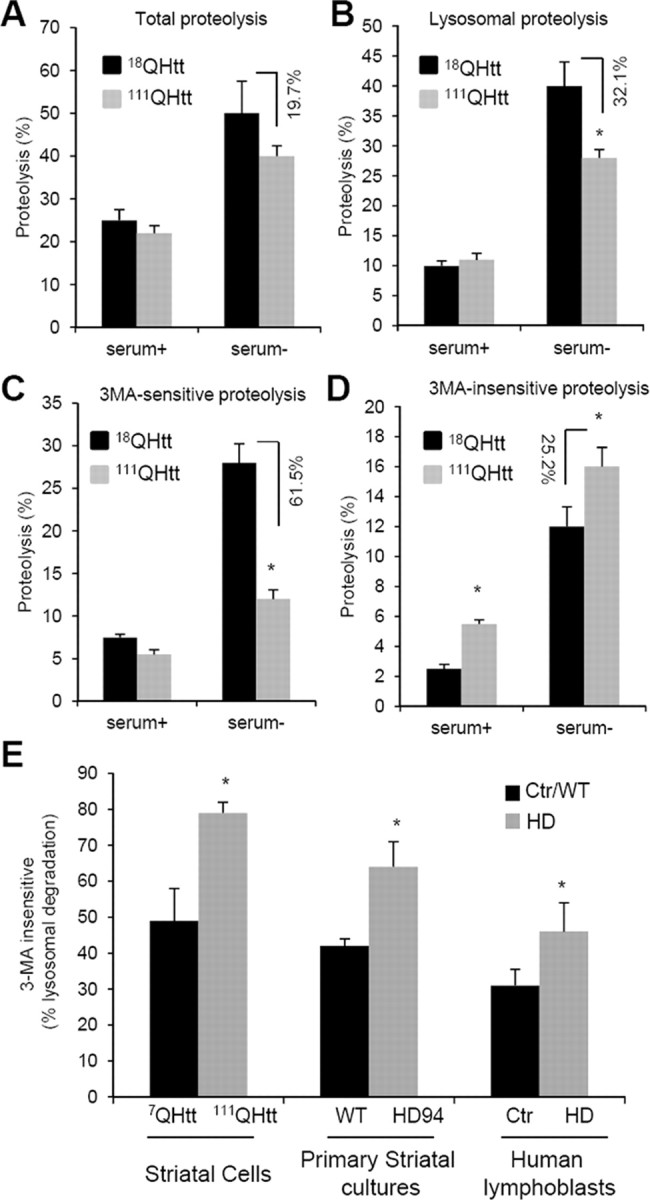
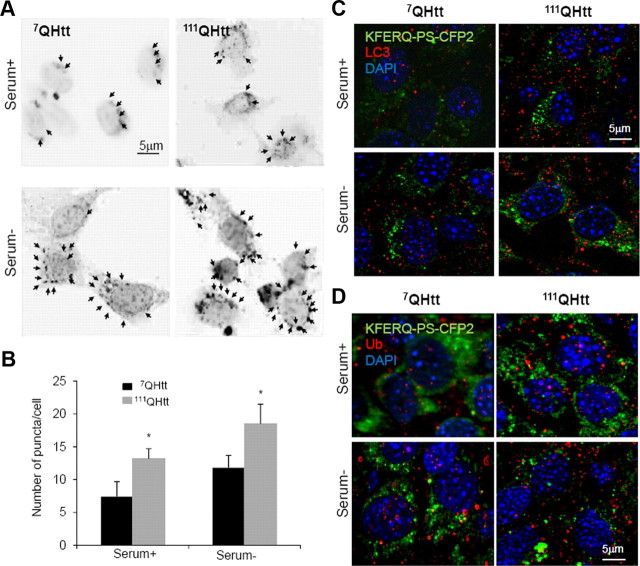
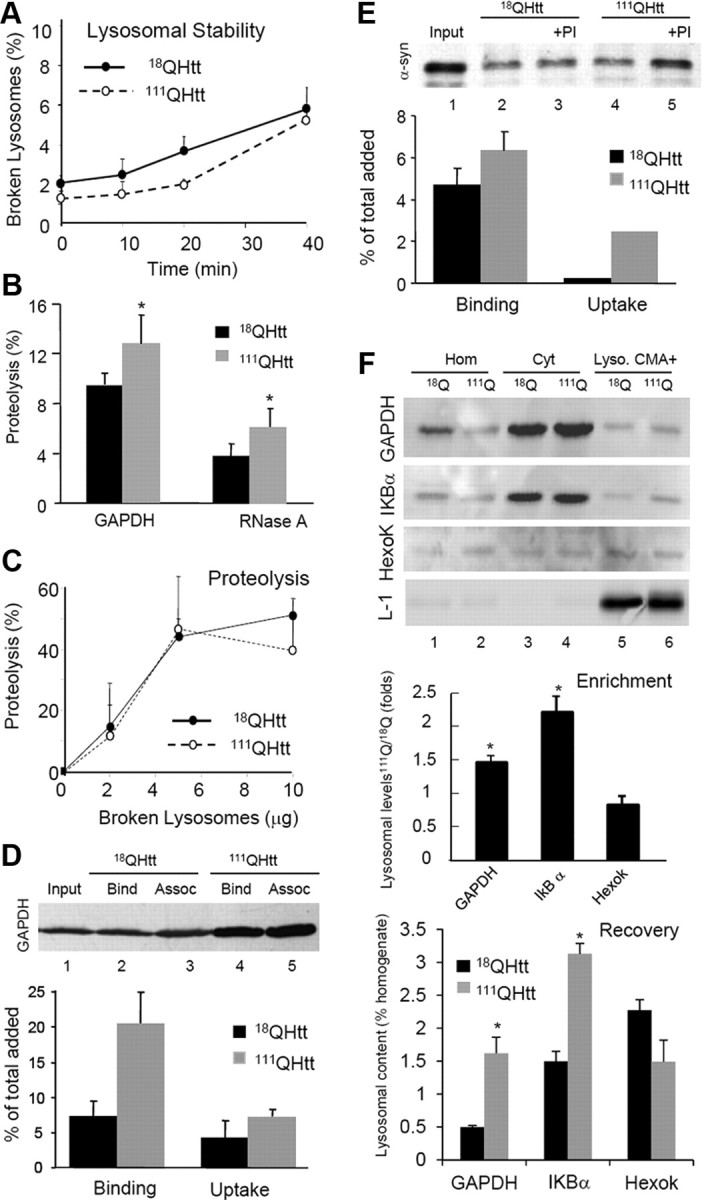
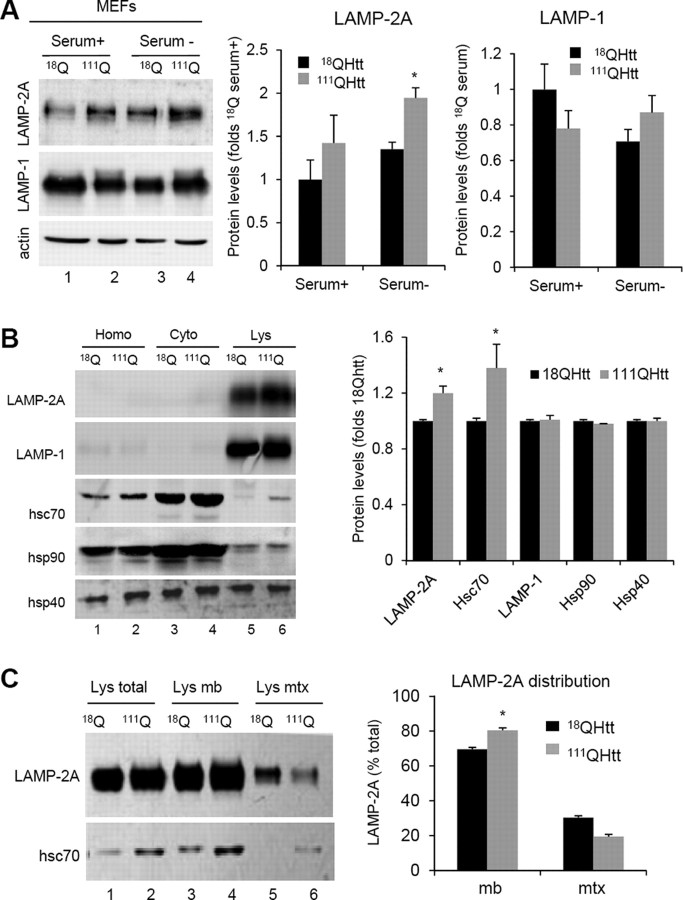
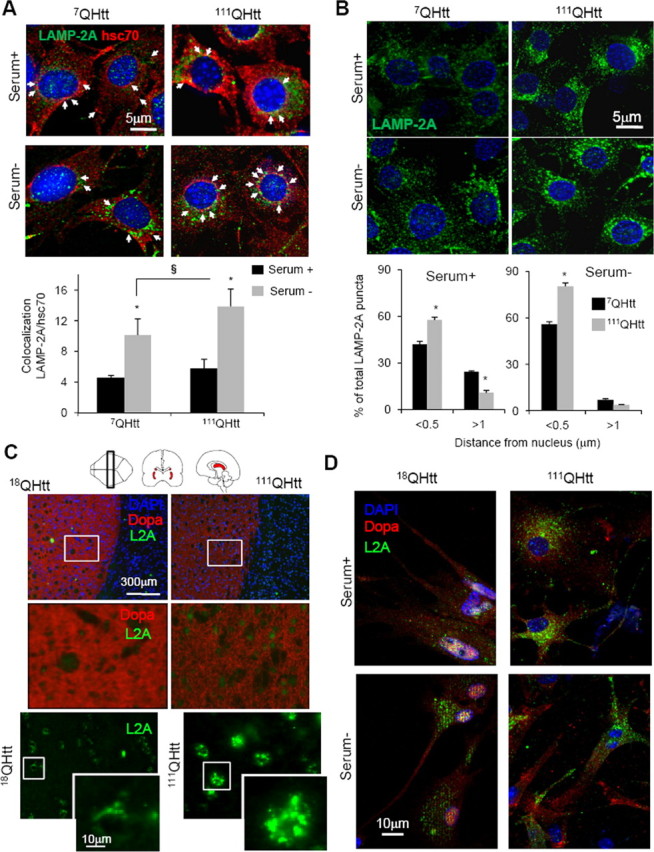
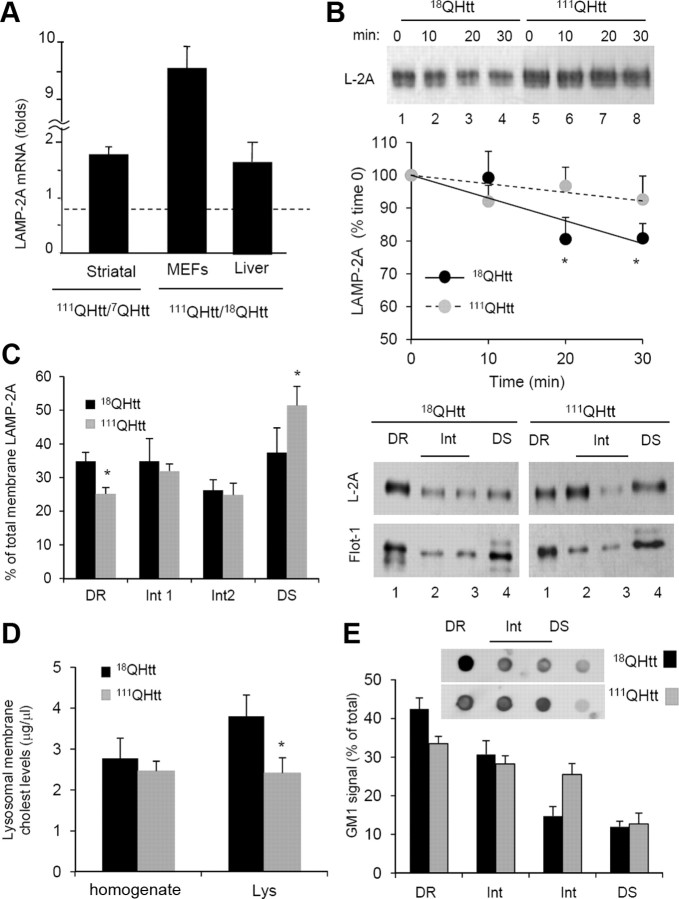
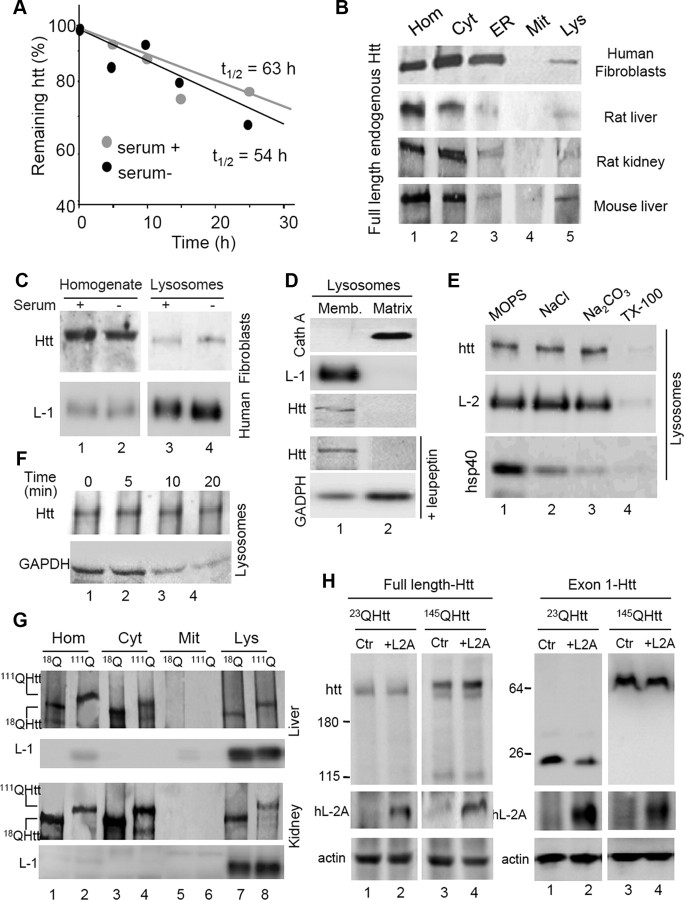
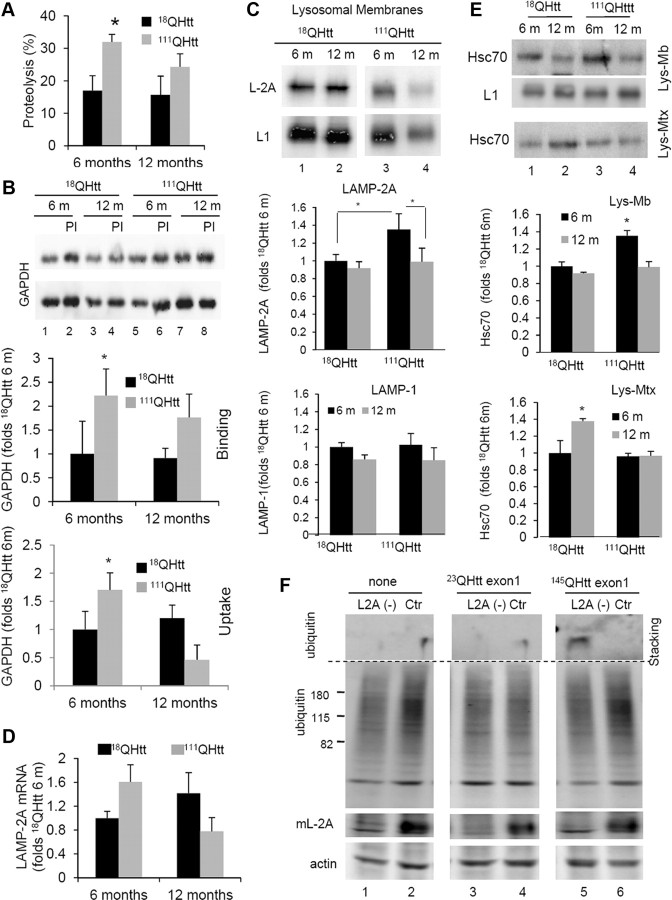
Autophagy contributes to the removal of prone-to-aggregate proteins, but in several instances these pathogenic proteins have been shown to interfere with autophagic activity. In the case of Huntington's disease (HD), a congenital neurodegenerative disorder resulting from mutation in the huntingtin protein, we have previously described that the mutant protein interferes with the ability of autophagic vacuoles to recognize cytosolic cargo. Growing evidence supports the existence of cross talk among autophagic pathways, suggesting the possibility of functional compensation when one of them is compromised. In this study, we have identified a compensatory upregulation of chaperone-mediated autophagy (CMA) in different cellular and mouse models of HD. Components of CMA, namely the lysosome-associated membrane protein type 2A (LAMP-2A) and lysosomal-hsc70, are markedly increased in HD models. The increase in LAMP-2A is achieved through both an increase in the stability of this protein at the lysosomal membrane and transcriptional upregulation of this splice variant of the lamp-2 gene. We propose that CMA activity increases in response to macroautophagic dysfunction in the early stages of HD, but that the efficiency of this compensatory mechanism may decrease with age and so contribute to cellular failure and the onset of pathological manifestations.


Figures

Figure 1.
Figure 1.
Non-macroautophagic lysosomal degradation is increased in HD cells. A–D, MEFs from 18QHtt and 111QHtt knock-in mice were subjected to metabolic labeling (as described in Materials and Methods), and the total rates of long-lived protein degradation (A), rates of lysosomal-dependent degradation (sensitive to inhibition by NH4Cl and leupeptin) (B), rates of macroautophagy-dependent degradation (lysosomal degradation sensitive to inhibition by 3-methyladenine) (C), and rates of non-macroautophagic lysosomal degradation (D) were calculated. E, The percentage of lysosomal degradation insensitive to 3-methyladenine (3MA) was calculated using similar procedures in striatal neuronal cell lines derived from 7QHtt and 111QHtt knock-in mice (left), primary striatal cultures from HD94 mice expressing mutant exon-1 Htt with 94 CAG repeats (middle), and lymphoblasts from healthy control (Ctr) and HD patients (right). All values are expressed as mean ± SE and are mean of at least three different experiments. WT, Wild type.
Figure 2.
Figure 2.
Augmented CMA activity in HD cells monitored by a CMA fluorescence reporter. A, Changes in the fluorescence pattern of a photoswitchable fluorescent CMA reporter in striatal cells derived from 7QHtt and 111QHtt knock-in mice maintained in the presence (Serum+) or absence (Serum−) of serum for 24 h. Left, Representative micrographs (insets show higher magnification and arrows point to fluorescent puncta). Scale bar, 5 μm. B, Quantification of the total number of fluorescent puncta in cells maintained in the presence or absence of serum. Values are mean ± SE of three different experiments with >50 cells counted per experiment. Micrographs are shown as inverted grayscale mode to better appreciate the vesicular pattern. Differences with control are significant for *p < 0.05. C,D, Colocalization of photo-converted KFERQ-PS-CFP2 (green) with LC3 (C) and ubiquitin (Ub) (D) in striatal cells from 7QHtt and 111QHtt knock-in mice maintained in the presence or absence of serum. Scale bars, 5 μm.
Figure 3.
Figure 3.
Uptake of CMA substrate proteins is increased in HD. A, Stability of the lysosomal membrane of intact lysosomes isolated from liver of 18QHtt and 111QHtt knock-in mice calculated by the hexosaminidase latency assay as described under Materials and Methods. Values are mean ± SE of three experiments with triplicate samples. B, Proteolysis of [14C] GAPDH and [14C]RNase A in the same samples. Values are expressed as percentage of the protein added and are mean ± SE of five different experiments with triplicates. C, Proteolysis of a pool of radiolabeled cytosolic proteins by increasing concentrations of disrupted lysosomes isolated from the same mice. Values are mean ± SE of three different mice. D, E, Association of GAPDH (D) or α-synuclein (E) with the same isolated lysosomes untreated or pretreated with protease inhibitors (PI). Input (lane 1), 1/10 of total protein added to lysosomes. Bottom graphs show the mean value of the binding and uptake of both proteins by isolated lysosomes calculated as described under Material and Methods. Values are expressed as percentage of the total protein added to the reaction and are mean ± SE of three different experiments. Assoc, Association. F, Immunoblots for the indicated proteins of homogenates (Hom), cytosol (Cyt), and lysosomes with high CMA activity (Lyso. CMA+) isolated from livers of the same animals. Hexok, Hexokinase. Graphs show quantification of the enrichment (top) and recovery (bottom) for each protein in the lysosomal fractions. Values are expressed as relative to the values in 18QHtt lysosomes and are mean ± SE of three different experiments. Differences with control are significant for *p < 0.05.
Figure 4.
Figure 4.
Increased levels of CMA components in lysosomes from HD cells. A, Immunoblots for the indicated proteins of MEFs from 18QHtt and 111QHtt knock-in mice maintained in medium supplemented (Serum+) or not (Serum−) with serum. Right, Quantification of the changes in LAMP-2A and LAMP-1 relative to their values in 18QHtt serum+. Values are mean ± SE, n = 5. B, Immunoblots for the indicated proteins of homogenates (Hom), cytosol (Cyt), and lysosomes with high CMA activity (Lys) isolated from livers of 18QHtt and 111QHtt knock-in mice. Right, Quantification of the changes in the indicated proteins in the lysosomal fraction relative to their values in 18QHtt lysosomes. Values are mean ± SE n = 4. C, Immunoblots for LAMP-2A and hsc70 of total lysosomes (Lys total), lysosomal membranes (Lys mb), and lysosomal matrices (Lys mtx) isolated from the same animals. Right, Percentage of lysosomal LAMP-2A present at the lysosomal membrane (mb) and matrix (mtx) in each group of lysosomes. Differences with control are significant for *p < 0.05.
Figure 5.
Figure 5.
Changes in the group of lysosomes with high activity for CMA in neuronal HD cells. A, Striatal cells from 7QHtt and 111QHtt knock-in mice maintained in the presence (Serum +) or absence (Serum −) of serum were costained for LAMP-2A and hsc70. Top, Representative images. Nuclei are stained in blue with DAPI. Bottom, Quantification of the percentage of colocalization of both proteins. Values are mean ± SE of three different experiments and colocalization was calculated in >50 cells in each condition. Values are different respect serum+ (*) or 7QHtt (§) for p < 0.05. Arrows indicate colocalization of both fluorophores. B, Relocation of LAMP-2A-positive vesicles (CMA-active lysosomes) toward the perinuclear region in the same cells maintained in the presence or absence of serum. Top, Nuclei are stained in blue with DAPI. Bottom, Quantification of the distribution of lysosomes (LAMP-2A–positive puncta) with respect to the nucleus. The percentage of total vesicles at the indicated distances is shown. Values are mean of the quantification of 8–10 cells per condition in two independent experiments. Scale bars, 5 μm. C, Immunohistochemistry for LAMP-2A in brain sections from 18Qhtt and 111Qhtt knock-in mice. Nuclei are highlighted in blue with DAPI, green shows LAMP-2A staining, and red indicates dopaminergic-positive neurons (striatal region). Different magnification images are shown. D, Immunofluorescence for LAMP-2A of neuronal cultures from the same mice maintained in the presence or absence of serum. Dopaminergic neurons are stained in red and nuclei are highlighted in blue.
Figure 6.
Figure 6.
Mechanisms of LAMP-2A upregulation in HD. A, Changes in the mRNA levels of LAMP-2A in striatal cell lines, MEFs, and liver from control and HD knock-in mice. Values are expressed relative to the value in their corresponding controls and are mean ± SE from 3–4 different experiments. B, Degradation of LAMP-2A in the membranes of lysosomes isolated from livers of 18QHtt/111QHtt knock-in mice at the indicated times of incubation in MOPS buffer at 37°C. Top, Representative immunoblot for LAMP-2A. Bottom, Kinetics of degradation of LAMP-2A calculated by densitometric analysis of immunoblots such as the one shown here. Values are expressed as a percentage of the total LAMP-2A at time 0 and are mean ± SE of three different experiments. C, Distribution of LAMP-2A and flotillin-1 in different fractions of the lysosomal membrane. Lysosomes from livers of 18QHtt/111QHtt knock-in mice were extracted with 1% Triton X-114 and then subjected to sucrose gradient centrifugation. Aliquots collected from top to bottom were grouped as the detergent-resistant (DR), intermediate (Int), and detergent-soluble (DS) fractions and subjected to SDS-PAGE and immunoblotted for LAMP-2A. The graph on the left shows densitometric quantification of the immunoblot. Values are expressed as percentage of the total LAMP-2A in lysosomes in each group. D, Cholesterol (cholest) levels in CMA active lysosomes (Lys) isolated from livers of 18QHtt/111QHtt knock-in mice. Values are mean ± SE of three different experiments. E, Dot blot analysis for the ganglioside GM1 in the same fractions used in C immobilized on a nitrocellulose membrane, incubated with 1 μg/ml recombinant toxin subunit B, and then with the antibody against this toxin. The graph shows densitometric quantification of the dot blots. Inset, Representative GM1 dot blots. Differences with control are significant for *p < 0.05.
Figure 7.
Figure 7.
Degradation of full-length and exon-1 Htt by CMA. A, Kinetics of degradation of Htt in fibroblasts maintained in the presence or absence of serum. Half-lives are indicated. B, Immunoblot for Htt in the indicated subcellular fractions isolated from human fibroblasts in culture, rat liver and kidney, and mouse liver. Hom, homogenate; Cyt, cytosol; ER, endoplasmic reticulum; Mit, mitochondria; Lys, lysosomes. C, Immunoblot for Htt and LAMP-1 (L-1) of homogenates and lysosomes from fibroblasts maintained in the presence or absence of serum. D, Immunoblot for the indicated proteins of lysosomal membranes (Memb.) and matrices isolated from mouse liver. Where indicated, mice were injected with leupeptin 2 h before lysosomal isolation. Cath A, Cathepsin A. E, Immunoblot for the indicated proteins of mouse lysosomes subjected to washes with MOPS, 1 m NaCl, 0.1 m NaCO2, or 1% Triton X-100. L-2, LAMP-2. F, Immunoblot for Htt and GAPDH of lysosomes incubated for the indicated times in isotonic media. G, Immunoblot for Htt of the indicated fractions isolated from liver and kidney of 18QHtt and 111QHtt knock-in mice. H, Immunoblots for the indicated proteins in cells expressing full-length or exon1 23QHtt and 145QHtt control (Ctr) or transfected with a vector expressing human LAMP-2A (hL-2A).
Figure 8.
Figure 8.
Changes in CMA activity with age in an HD animal model. A, Proteolysis of a pool of radiolabeled cytosolic proteins by lysosomes isolated from 6- and 12-month-old 18QHtt and 111QHtt knock-in mice. Values are expressed as percentage of the amount of protein at time 0 and are mean ± SE of three different experiments. B, Binding and uptake of GAPDH by the same lysosomes. GAPDH (2 μg) was incubated with isolated lysosomes untreated or pretreated with protease inhibitors (PI). Top, Immunoblot for GAPDH in two different experiments. Bottom, Quantification of the binding or uptake of GAPDH by each group. Values are expressed relative to the values in 6-month-old 18QHtt and are mean ± SE of three different experiments. C, Immunoblots for LAMP-2A and LAMP-1 in membranes (same amount of protein loaded) from lysosomes isolated from livers of 6- or 12-month-old 18QHtt and 111QHtt knock-in mice. Bottom, Quantification of the changes in LAMP-2A and LAMP-1 content by densitometric analysis of the proteins in the lysosomal membrane and matrices. Values are expressed relative to the values in 6-month-old 18QHtt and are mean ± SE of 4–6 different experiments. D, Quantification of mRNA levels for LAMP-2A by semiquantitative real-time PCR in livers of old 18QHtt knock-in mice and are mean ± SE of 3–4 different experiments. E, Immunoblot for hsc70 and LAMP-1 of lysosomal membranes (Mb) and matrices (Mtx) from the same mice. Bottom, Quantification of the changes in hsc70. Values are expressed relative to the values in 6-month-old 18QHtt and are mean ± SE of 3–4 different experiments. F, Immunoblot for the indicated proteins in fibroblasts control (Ctr) or knocked-down for LAMP-2A transiently transfected with an empty vector (none) or vectors coding for 23Q or 145Q exon-1 Htt.

Similar articles

Cited by

References

    1. Agarraberes FA, Terlecky SR, Dice JF. An intralysosomal hsp70 is required for a selective pathway of lysosomal protein degradation. J Cell Biol. 1997;137:825–834. - PMC - PubMed
    1. Aniento F, Roche E, Cuervo AM, Knecht E. Uptake and degradation of glyceraldehyde-3-phosphate dehydrogenase by rat liver lysosomes. J Biol Chem. 1993;268:10463–10470. - PubMed
    1. Auteri JS, Okada A, Bochaki V, Dice JF. Regulation of intracellular protein degradation in IMR-90 human diploid fibroblasts. J Cell Physiol. 1983;115:167–174. - PubMed
    1. Bandyopadhyay U, Kaushik S, Varticovski L, Cuervo AM. The chaperone-mediated autophagy receptor organizes in dynamic protein complexes at the lysosomal membrane. Mol Cell Biol. 2008;28:5747–5763. - PMC - PubMed
    1. Bauer PO, Goswami A, Wong HK, Okuno M, Kurosawa M, Yamada M, Miyazaki H, Matsumoto G, Kino Y, Nagai Y, Nukina N. Harnessing chaperone-mediated autophagy for the selective degradation of mutant huntingtin protein. Nat Biotechnol. 2010;28:256–263. - PubMed

Publication types

MeSH terms

Substances