. 2011 Dec 11;15(1):70-80.
doi: 10.1038/nn.3000.

TRPA1 channels regulate astrocyte resting calcium and inhibitory synapse efficacy through GAT-3

Affiliations

TRPA1 channels regulate astrocyte resting calcium and inhibitory synapse efficacy through GAT-3

Eiji Shigetomi et al. Nat Neurosci. .

Abstract

Astrocytes contribute to the formation and function of synapses and are found throughout the brain, where they show intracellular store-mediated Ca(2+) signals. Here, using a membrane-tethered, genetically encoded calcium indicator (Lck-GCaMP3), we report the serendipitous discovery of a new type of Ca(2+) signal in rat hippocampal astrocyte-neuron cocultures. We found that Ca(2+) fluxes mediated by transient receptor potential A1 (TRPA1) channels gave rise to frequent and highly localized 'spotty' Ca(2+) microdomains near the membrane that contributed appreciably to resting Ca(2+) in astrocytes. Mechanistic evaluations in brain slices showed that decreases in astrocyte resting Ca(2+) concentrations mediated by TRPA1 channels decreased interneuron inhibitory synapse efficacy by reducing GABA transport by GAT-3, thus elevating extracellular GABA. Our data show how a transmembrane Ca(2+) source (TRPA1) targets a transporter (GAT-3) in astrocytes to regulate inhibitory synapses.


Figures
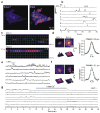
Figure 1
Figure 1. Spotty Ca2+ signals in rat hippocampal astrocyte-neuron co-cultures
a. Images of astrocytes expressing Lck-GCaMP3 in co-cultures. Left: basal fluorescence of Lck-GCaMP3 for an astrocyte before any spotty Ca2+ signals. Right: a maximum projection image of a 300 frame video. Eight regions of interest are shown (as 1–8). The intensity profiles of these eight ROIs are shown in b. c. Still frames between 141 and 240 s and between 171 and 270 s from the graph in panel a for ROI 4 and ROI 6. The time between images is 1 s. d. Images of spotty Ca2+ signals for ROI 1 and ROI 3. A graph on the right shows the full width of half maxima (FWHM) of the events (5.0 ± 0.6 μm, n = 10 sites). e. Intensity profiles of the six spotty Ca2+ signals observed by Fluo-4 Ca2+ indicator with total internal reflection fluorescence (TIRF) microscopy. f. Images of spotty Ca2+ signals visualized by TIRF microscopy. Spotty Ca2+ signals detected by TIRF occurred with a frequency of 1.8 events/min (n = 46 sites from 27 cells), lasted 0.6 ± 0.07 s (n = 408 events) and displayed peak dF/F values of ~100% (1.0 ± 0.03, n = 427). The graph on the right shows the FWHM of the events (5.1 ± 0.4 μm, n = 19 sites). g. Spotty Ca2+ signals imaged with Lck-GCaMP3 were reduced by ~95% in Ca2+ free conditions (Supplementary Video 2, n = 155 sites from 14 cells). Vertical lines are s.e.m.
Figure 2
Figure 2. Evidence that TRPA1 channels mediate spotty Ca2+ signals in co-cultures
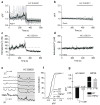
a. Maximum projections of a 300 frame video before (control), during and after (washout) of HC 030031 (40 μM). HC 030031 almost completely reduced spotty Ca2+ signals (Supplementary Video 3, from 0.49 ± 0.04 events/min to 0.025 ± 0.01 events/min by HC 030031; n = 96 sites from 11 cells, p < 0.001). b. Intensity versus time profile of eight ROIs. c. Maximal projection of 300 frame video with transfection of control siRNA (right panels, Supplementary Video 4) or TRPA1 siRNA #1 (left panels, Supplementary Video 5). d. Percentage of cells displaying spotty Ca2+ signals. TRPA1 siRNAs significantly (p < 0.01) reduced the number of astrocytes showing spotty Ca2+ signals (Fisher’s exact test, control 43.6%, n=55 cells; siRNA#1, 9.1%, n=22 cells, p = 0.0025; siRNA#2, 12.1%, n = 33 cells, p = 0.0014; siRNA#3, 18.8%, n = 48 cells, p = 0.0052). e. Summary data of ATP-evoked Ca2+ signals measured with Lck-GCaMP3, in control conditions and when TRPA1 siRNAs were used. There was no significant change by TRPA1 siRNA transfection (control 3.5 ± 0.1, siRNA#1, 4.0 ± 0.2, p = 0.105; siRNA#2, 3.0 ± 0.3, p = 0.055; siRNA#3, 3.2 ± 0.2, p = 0.194). f. Numerous spotty Ca2+ signals were seen during the application of AITC (1 μM; Supplementary Video 6). AITC increased the frequency of spotty Ca2+ signals from 0.57 ± 0.07 to 1.6 ± 0.13 events min−1 (p < 0.001). g. Summary data on the frequency of spotty Ca2+ signals with or without AITC. With TRPA1 siRNA#1 transfection, AITC no longer increased the number of the events. h. AITC (20 μM)-induced global Ca2+ transients in astrocytes observed by Fluo-4. i. Average data showing that global Ca2+ signals evoked by AITC are blocked by siRNA against TRPA1. j. 100 μM AITC-evoked global Ca2+ increases measured in astrocytes in the stratum radiatum. The gray traces are representative single cells, whereas the black traces are the averages. k. Summary data for experiments such as those shown in panel j. The right hand bar graph plots the peak dF/F of the AITC-evoked responses (100 μM; n = 19) in relation to those evoked by DHPG (10 μM; n = 33) and ADPβS (30 μM; n = 21). Vertical lines are s.e.m.
Figure 3
Figure 3. TRPA1 channels regulate basal Ca2+ levels in co-cultures and astrocytes in slices
a–b. Graphs plots dF/F over time from representative imaging experiments from astrocytes (a) and neurons (b) loaded with Fluo-4 (in co-cultures). For this comparison between neurons and astrocytes we studied both cells at 5–8 days in culture, when the neurons show less spontaneous activity than the astrocytes (compare panels a and b). c–d. Similar experiments to those shown in a–b, but for astrocytes (c) and neurons (d) loaded with Fura-2. The thick lines are an average from 10 and 7 cells for astrocytes and neurons, respectively. Note, with the use of Fura-2 the baseline is increasing for astrocytes but not neurons, possibly reflecting UV activation of TRPA1. The dashed lines in panels c and d correspond to the mean level of Ca2+ before HC 030031. e. Experiments such as those in a, but for astrocytes loaded with Fluo-4 in acute hippocampal slices (Supplementary Fig. 9). f. A cumulative probability plot of dF/F evoked by HC 030031 applications to astrocytes in acute hippocampal slices from wild type and TRPA1−/− mice. g. Bar graph showing that the ability of HC 030031 to reduce resting Ca2+ levels in astrocytes from TRPA1−/− mice is almost completely abolished. Astrocytes from wild type and TRPA1−/− mice responded equally well to ADPβS (30 μM). Vertical lines are s.e.m.
Figure 4
Figure 4. Buffering astrocyte intracellular Ca2+ levels decreases mIPSC amplitudes in interneurons, but not pyramidal neurons in hippocampal slices
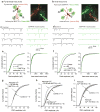
a. The left cartoon shows the protocol whereas the image shows a representative confocal image. The astrocytes were loaded with Alexa-488 (100 μM) whereas the neurons were loaded with Alexa-568 (100 μM). Recordings were made from neurons and astrocytes that were no more than 100 μm apart. In this approach, we recorded from a population of neurons, determined mIPSC parameters and then record from a second population in which the astrocyte nearby had also been patched. b. As in a, but for dual recordings from astrocytes and interneurons in the stratum radiatum region. c. Representative mIPSCs recorded from CA1 pyramidal neurons under controls settings, and also for pyramidal neurons located near astrocytes that were dialyzed with 13 mM BAPTA (>20 min). d. As in c, but for whole-cell recording from interneurons. e. Cumulative probability plots of pyramidal neuron mIPSC amplitudes and inter-event intervals from control neurons and those located near astrocytes dialyzed with BAPTA. f. As in e, but for mIPSCs recorded from interneurons. g–h. Average cumulative probability plots for interneurons located near astrocytes dialyzed with intracellular solutions to clamp the bulk concentration of Ca2+ ions to known levels using either the fast chelator BAPTA, or the slower chelator EGTA. No significant changes were observed for the inter-event interval distributions (Supplementary Fig. 11). In this and all subsequent figures, the vertical lines on the cumulative probability plots represent the standard error of the mean (s.e.m).
Figure 5
Figure 5. Effect of the TRPA1 channel blocker (HC 030031) on mIPSCs arriving onto pyramidal neurons and interneurons in the hippocampus
a. Representative traces for mIPSCs recorded from CA1 pyramidal neurons before and during bath applications of HC 030031 (40 μM) for 8 minutes. The traces and the average cumulative probability plot below shows that HC 030031 produced no effect on mIPSC amplitudes (frequency was also not affected: reported in the text). b. As in a, but for recordings from interneurons. c. Plots the normalized mIPSC amplitude over time for cells where HC 030031 was applied for the duration indicated by the solid black bar in relation to cells where vehicle (0.1% DMSO) was applied. d. Summarizes average mIPSC amplitude and frequency data recorded from interneurons under the indicated conditions. e. HC 030031 did not alter mIPSC amplitudes when astrocytes were previously dialyzed with BAPTA. The parallel control experiments with BAPTA are shown in Supplementary Fig. 13a,b. Vertical lines are s.e.m.
Figure 6
Figure 6. Role of GAT-3 GABA transporters
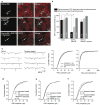
a. The upper traces show the effect of bicuculline (50 μM) applications on holding current (at −60 mV) measured from interneurons under control settings, or from interneurons located within 100 μm of astrocytes dialyzed with BAPTA for 20 mins (right). The bar graph summarizes the findings. We did not measure reversal upon bicuculline washout as this was incomplete by 30 mins. b. Representative traces for currents evoked by puff application of GABA (30 μM) in control conditions and after 20–25 mins of astrocyte dialysis with BAPTA (the traces are from different cells). The bar graph summarizes the findings. c. The confocal images show GAT-3 and GFAP staining in stratum radiatum (Supplementary Fig. 14). d. Summary data for mIPSC amplitudes (upper graph) and frequency (lower graph) when all GABA transporters were blocked (nipecotic acid; 100 μM), when GAT-1 was blocked (NO-711; 10 μM), when GAT-2 was blocked (hypotaurine; 100 μM) and when GAT-3 was blocked with β-alanine (100 μM). e. Average cumulative probability plots of mIPSC amplitude and inter-event interval distributions under control settings and after blockade of GAT-3 with β-alanine (100 μM). f. The bar graphs summarize the finding that astrocyte dialysis with BAPTA (13 mM) occluded the effect of β-alanine on mIPSC amplitudes (upper panel). The mIPSC frequency was not affected. g. As in c, but in this case prior application of HC 030031 (40 μM) occluded the effect of β-alanine on mIPSC amplitudes. mIPSC frequency was unaffected. In these graphs ** indicated p < 0.01 by an unpaired Students t test. Vertical lines are s.e.m.
Figure 7
Figure 7. Astrocyte dialysis with BAPTA regulates GAT-3 in astrocytes
a. The upper panels show images of an astrocyte in the stratum radiatum. The astrocyte had been dialyzed with Alexa-488 and then processed for GAT-3 staining. The middle panels show images for similar experiments when the astrocyte had been dialyzed with Alexa-488 and BAPTA (13 mM). In this case the colocalisation between Alexa-488 and GAT-3 was reduced because there was less GAT-3 immunostaining in the patched astrocyte. The lower panels show images for slices pretreated with dynasore. b. Summarizes data from experiments such as those shown in panel a. c. Representative traces and cumulative probability plots show that dynasore (100 μM) did not affect mIPSC amplitude or inter-event interval distributions during recordings from interneurons. d. Dynasore pretreatment abolished the ability of astrocyte BAPTA dialysis to reduce mIPSC amplitudes onto interneurons. e. Dynasore pretreatment also abolished the ability of HC 030031 to reduce the mIPSC amplitudes. f. Dynasore pretreatment did not affect the ability of β-alanine (GAT-3 blocker) to reduce the amplitude of mIPSCs onto interneurons. For panels d–f, the mIPSC frequencies are presented in the text (they were not altered). The scale bar for the images is 20 μm (in panel a). Vertical lines are s.e.m.
Figure 8
Figure 8. The effects of HC 030031 and astrocyte BAPTA dialysis are abolished in the TRPA1−/− mice
a. Representative traces for interneuron mIPSCs recorded from wild type control mice before and during HC 030031 applications (40 μM). The mIPSCs were reduced in amplitude as shown in earlier parts of this study. b. As in a, but for recordings from TRPA1−/− mice. In this case HC 030031 was without effect. c. Summary data for mIPSC amplitudes from TRPA1−/− and wild type controls for experiments such as those shown in panels a and b. d. Summary data for mIPSC amplitudes from TRPA1−/− and wild type controls for experiments where astrocytes were dialyzed with BAPTA. Vertical lines are s.e.m.

Comment in

Similar articles

Cited by

References

    1. Halassa MM, Haydon PG. Integrated brain circuits: astrocytic networks modulate neuronal activity and behavior. Annu Rev Physiol. 2010;72:335–355. - PMC - PubMed
    1. Attwell D, et al. Glial and neuronal control of brain blood flow. Nature. 2010;468:232–243. - PMC - PubMed
    1. Henneberger C, Papouin T, Oliet SH, Rusakov DA. Long-term potentiation depends on release of D-serine from astrocytes. Nature. 2010;463:232–236. - PMC - PubMed
    1. Agulhon C, Fiacco TA, McCarthy KD. Hippocampal short- and long-term plasticity are not modulated by astrocyte Ca2+ signaling. Science. 2010;327:1250–1254. - PubMed
    1. Sontheimer H. Voltage-dependent ion channels in glial cells. Glia. 1994;11:156–172. - PubMed

Publication types