. 2011 Dec 11;8(1):57-64.
doi: 10.1038/nchembio.736.

Peroxide-dependent sulfenylation of the EGFR catalytic site enhances kinase activity

Affiliations

Peroxide-dependent sulfenylation of the EGFR catalytic site enhances kinase activity

Candice E Paulsen et al. Nat Chem Biol. .

Abstract

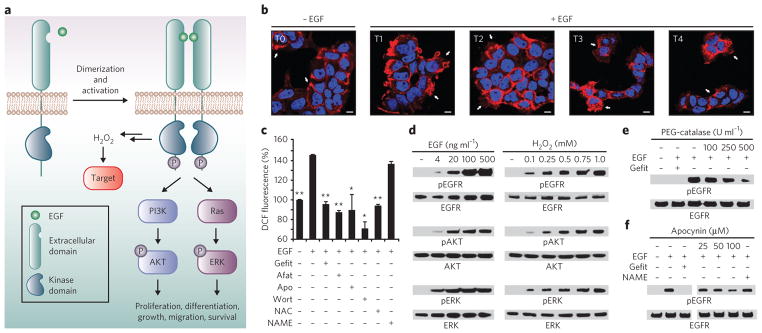
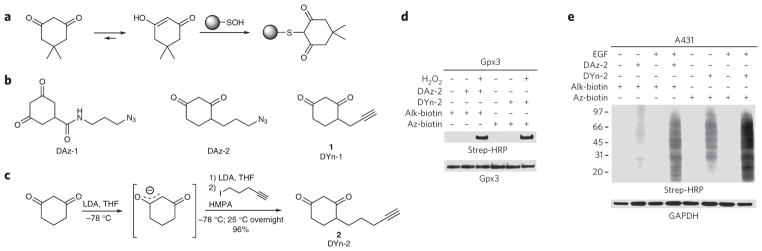
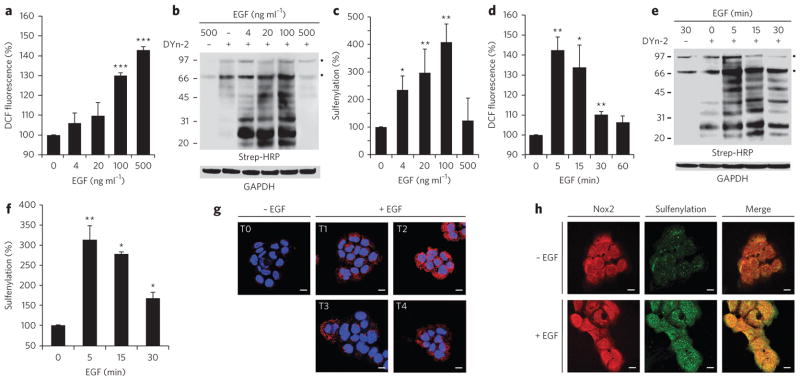
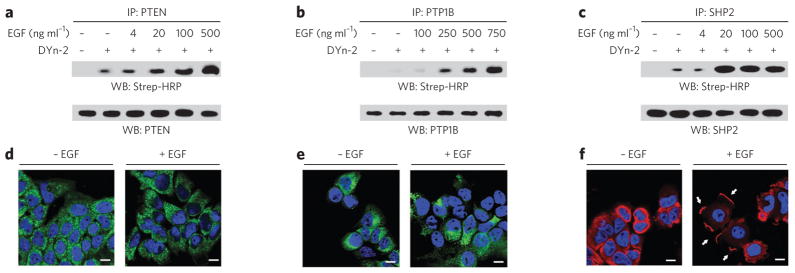
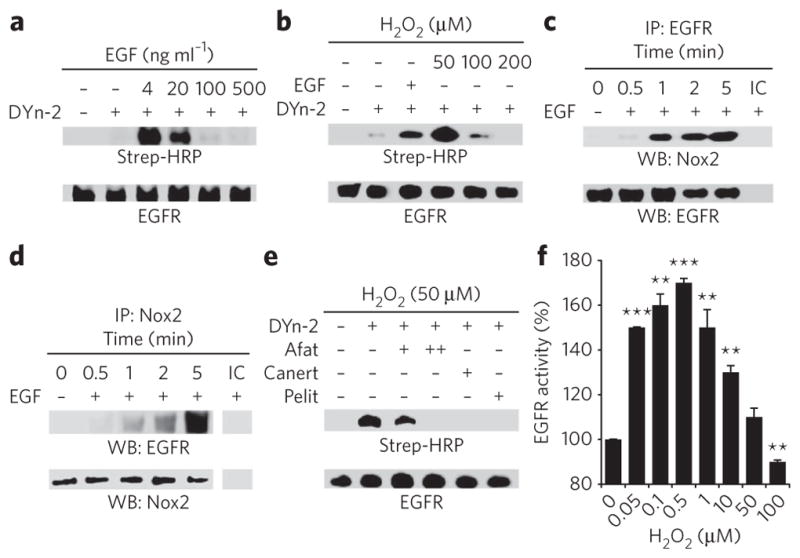
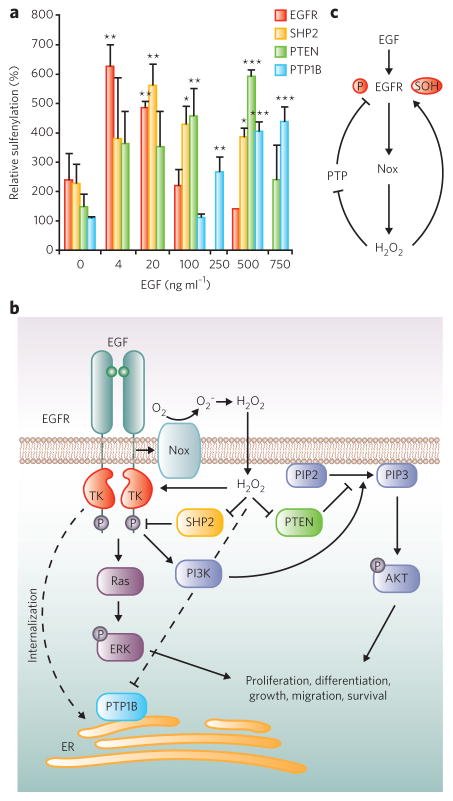
Protein sulfenylation is a post-translational modification of emerging importance in higher eukaryotes. However, investigation of its diverse roles remains challenging, particularly within a native cellular environment. Herein we report the development and application of DYn-2, a new chemoselective probe for detecting sulfenylated proteins in human cells. These studies show that epidermal growth factor receptor-mediated signaling results in H(2)O(2) production and oxidation of downstream proteins. In addition, we demonstrate that DYn-2 has the ability to detect differences in sulfenylation rates within the cell, which are associated with differences in target protein localization. We also show that the direct modification of epidermal growth factor receptor by H(2)O(2) at a critical active site cysteine (Cys797) enhances its tyrosine kinase activity. Collectively, our findings reveal sulfenylation as a global signaling mechanism that is akin to phosphorylation and has regulatory implications for other receptor tyrosine kinases and irreversible inhibitors that target oxidant-sensitive cysteines in proteins.


Conflict of interest statement

Competing financial interests

The authors declare no competing financial interests.

Figures

Figure 1
Figure 1. Cellular redox status affects EGF-mediated signaling
(a) EGF binding to EGFR and subsequent dimerization induce receptor autophosphorylation on specific tyrosine residues within the cytoplasmic domain. The newly phosphorylated (P) sites serve as interaction platforms for proteins involved in key prosurvival pathways, such as the PI 3K-AKT and Ras-ERK pathways. Receptor-ligand interaction also stimulates the production of ROS and oxidation of intracellular biomolecules, leading to modulation of the signaling cascade. (b) Confocal fluorescence images of EGFR localization in A431 cells before (T0) and after stimulation with 100 ng ml−1 EGF for 2 min, 15 min, 30 min and 60 min (T1, T2, T3 and T4, respectively). White arrows highlight changes in receptor localization (T0, plasma membrane; T1, membrane ruffles; T2, cell stretching and migration; T3, perinuclear and endosomal membranes; T4, cell surface and ruffles). Nuclei were counterstained with DAPI (blue). Scale bars, 10 μm. (c) EGF-induced ROS generation in A431 cells as revealed by DC F fluorescence. Where specified, cells were treated with gefitinib (Gefit), afatinib (Afat), apocynin (Apo), wortmannin (Wort), NAC or L-NAME before EGF stimulation. Data are representative of three independent readings and were normalized to the vehicle control. Error bars, ± s.e.m. *P < 0.05, **P < 0.001 when compared against cells treated with EGF only. (df) Western blots showing phosphorylated (p) and total EGFR, AKT and/or ERK. A431 cells were stimulated with the indicated concentrations of EGF, H2O2 or vehicle for 5 min (d) or with 100 ng ml−1 EGF or vehicle for 5 min (e,f). Where specified, cells were treated with the indicated concentrations of PEG-catalase (e), apocynin (f) or gefitinib (e,f) before EGF stimulation. Full western blots for all experiments are shown in Supplementary Figure 2.
Figure 2
Figure 2. Development and validation of probes for detecting sulfenic acid
(a) Selective reaction between sulfenic acid and dimedone. (b) Chemical structures of chemical reporters for sulfenic acid. (c) Design and synthesis of DYn-2 (2). LD A, lithium diisopropylamide; HMPA, hexamethyl-phosphoramide. (d) Comparison of DAz-2 and DYn-2 detection of sulfenic acid in recombinant Gpx3. 50 μM protein was untreated or exposed to 100 μM H2O2 and incubated in the presence or absence of 1 mM probe for 15 min at 37 °C. Labeled proteins were detected by streptavidin–horseradish peroxidase (Strep-HRP) western blot. Comparable protein loading was confirmed by reprobing the blot with His tag–specific antibody. (e) Western blots showing DAz-2 and DYn-2 detection of protein sulfenic acids and total GAPDH in A431 cells. Cells were stimulated with 100 ng ml−1 EGF or vehicle for 5 min and then incubated with 5 mM probe or vehicle for 1 h at 37 °C.
Figure 3
Figure 3. EGF-mediated ROS production and protein sulfenylation
(af) ROS production, as indicated by DCF fluorescence (a,d) or western blotting for protein sulfenylation with Strep-HRP (b,e), in A431 cells incubated with EGF at the indicated concentrations (a,b) or for the indicated times (d,e). In d and e, all cells were stimulated with 500 (d) or 100 ng ml−1 EGF (e) or vehicle. Panels c and f show densitometric quantification of b and e, respectively. Throughout, GAPDH was used as a loading control. Data are representative of three independent readings for ROS measurements and four independent experiments for western blots. Error bars, mean ± s.e.m. *P < 0.05, **P < 0.01 and ***P < 0.001 compared to vehicle control. (g) Fluorescence images of sulfenylation (red) in A431 cells before (T0) and after stimulation with 100 ng ml−1 EGF for 0.5 min, 1 min, 1.5 min or 2 min, followed by treatment with 5 mM dimedone for 5 min at 37 °C in EGF-containing medium; total EGF exposure was 5.5 min, 6 min, 6.5 min and 7 min (T1–4, respectively). Nuclei were counterstained with DAPI (blue). Scale bars, 10 μm. (h) A431 cells were stimulated with 100 ng ml−1 EGF or vehicle for 0.5 min and treated with dimedone as in g. Cells were stained for the dimedone-protein adduct (green) and Nox2 (red). Scale bars, 10 μm.
Figure 4
Figure 4. Differential sulfenylation of PTPs in EGF-treated cells
(ac) Western blots (WB) showing sulfenylated and total immunoprecipitated PTEN, PTP1B and SHP2. A431 cells were stimulated with EGF or vehicle for 2 min at the indicated concentrations and then incubated with 5 mM DYn-2 or vehicle for 1 h at 37 °C. Lysates were immunoprecipitated with mouse PTEN- (a), mouse PTP1B- (b) or rabbit SHP2-specific antibody (c). Sulfenylation of PTPs was detected by Strep-HRP western blot. Western blots were reprobed for total PTP as indicated to verify equivalent recovery. (df) Confocal fluorescence images of A431 cells stimulated with vehicle or 100 ng ml−1 EGF for 5 min. Cells were stained with PTEN- (d), PTP1B- (e) or SHP2-specific antibody (f). Nuclei were counterstained with DAPI (blue). Scale bars, 10 μm. The white arrows in f highlight the changes in subcellular localization of SHP2 after stimulation with EGF.
Figure 5
Figure 5. EGF-mediated sulfenylation of EGFR Cys797 in cells
(a,b) Western blots showing sulfenylated and total EGFR. A431 cells were stimulated with EGF at the indicated concentrations or vehicle for 2 min (a) or H2O2 for 10 min (b), and sulfenic acids were detected by Strep-HRP western blot. (c,d) Western blots showing coimmunprecipitation of Nox2 and EGFR. A431 cells were stimulated with 100 ng ml−1 EGF or vehicle for the indicated times and immunoprecipitated using EGFR-specific (c) or Nox2-specific antibodies (d). Comparable recovery of immunoprecipitated (IP ) EGFR was confirmed by probing the blot with EGFR-specific antibody in c and with Nox2-specific antibody in d. IC, isotype control. (e) Western blot showing sulfenylated and total EGFR. A431 cells were incubated with 1 μM or 5 μM afatinib (+ and ++, respectively), 10 μM canertinib (Canert), 1 μM pelitinib (Pelit) or vehicle before treatment with H2O2, and sulfenylation was detected as in b. (f) Measurement of EGFR tyrosine kinase activity in vitro. Data are representative of three independent readings and represent the mean ± s.e.m. **P < 0.01 and ***P < 0.001 compared to vehicle control.
Figure 6
Figure 6. Model for redox regulation of EGFR signaling
(a) Densitometric quantification of EGFR and PTP sulfenylation from blots in Figures 4a–c and 5a. Data are representative of four independent experiments and represent the mean ± s.e.m. for each protein. *P < 0.05, **P < 0.01 and ***P < 0.001 compared to vehicle control. (b) The mitogen EGF binds to EGFR and induces the production of ROS in A431 cells via Nox2. The proximity of target proteins to Nox2 has an impact on the rate of cysteine oxidation within the cell. Dashed lines are relevant to EGFR internalization. TK, tyrosine kinase. (c) Model for H2O2-mediated increase in EGFR kinase activity. Nox-generated H2O2 directly modifies EGFR at a critical cysteine (Cys797) in the active site, which enhances its tyrosine kinase activity. Endogenous H2O2 also oxidizes and deactivates PTPs, which serves to maintain EGFR phosphorylation. Collectively, these events lead to an increase in receptor autophosphorylation, which promotes signaling through downstream pathways.

Similar articles

Cited by

References

    1. Finkel T. Signal transduction by reactive oxygen species. J Cell Biol. 2011;194:7–15. - PMC - PubMed
    1. Dickinson BC, Chang CJ. Chemistry and biology of reactive oxygen species in signaling or stress responses. Nat Chem Biol. 2011;7:504–511. - PMC - PubMed
    1. Miller EW, Tulyathan O, Isacoff EY, Chang CJ. Molecular imaging of hydrogen peroxide produced for cell signaling. Nat Chem Biol. 2007;3:263–267. erratum 3 349 2007. - PubMed
    1. Woo HA, et al. Inactivation of peroxiredoxin I by phosphorylation allows localized H2O2 accumulation for cell signaling. Cell. 2010;140:517–528. - PubMed
    1. Paulsen CE, Carroll KS. Orchestrating redox signaling networks through regulatory cysteine switches. ACS Chem Biol. 2010;5:47–62. - PMC - PubMed

Publication types