The NK cell response to mouse cytomegalovirus infection affects the level and kinetics of the early CD8(+) T-cell response
- PMID: 22156533
- PMCID: PMC3302391
- DOI: 10.1128/JVI.06042-11
The NK cell response to mouse cytomegalovirus infection affects the level and kinetics of the early CD8(+) T-cell response
Abstract
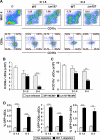
Natural killer (NK) cells and CD8(+) T cells play a prominent role in the clearance of mouse cytomegalovirus (MCMV) infection. The role of NK cells in modulating the CD8(+) T-cell response to MCMV infection is still the subject of intensive research. For analyzing the impact of NK cells on mounting of a CD8(+) T-cell response and the contribution of these cells to virus control during the first days postinfection (p.i.), we used C57BL/6 mice in which NK cells are specifically activated through the Ly49H receptor engaged by the MCMV-encoded ligand m157. Our results indicate that the requirement for CD8(+) T cells in early MCMV control inversely correlates with the engagement of Ly49H. While depletion of CD8(+) T cells has only a minor effect on the early control of wild-type MCMV, CD8(+) T cells are essential in the control of Δm157 virus. The frequencies of virus epitope-specific CD8(+) T cells and their activation status were higher in mice infected with Δm157 virus. In addition, these mice showed elevated levels of alpha interferon (IFN-α) and several other proinflammatory cytokines as early as 1.5 days p.i. Although the numbers of conventional dendritic cells (cDCs) were reduced later during infection, particularly in Δm157-infected mice, they were not significantly affected at the peak of the cytokine response. Altogether, we concluded that increased antigen load, preservation of early cDCs' function, and higher levels of innate cytokines collectively account for an enhanced CD8(+) T-cell response in C57BL/6 mice infected with a virus unable to activate NK cells via the Ly49H-m157 interaction.
Figures


Similar articles
-
Cytokine-Mediated Activation of NK Cells during Viral Infection.J Virol. 2015 Aug;89(15):7922-31. doi: 10.1128/JVI.00199-15. Epub 2015 May 20. J Virol. 2015. PMID: 25995253 Free PMC article.
-
The specific NK cell response in concert with perforin prevents CD8(+) T cell-mediated immunopathology after mouse cytomegalovirus infection.Med Microbiol Immunol. 2015 Jun;204(3):335-44. doi: 10.1007/s00430-015-0409-y. Epub 2015 Mar 26. Med Microbiol Immunol. 2015. PMID: 25809566
-
Natural killer cells promote early CD8 T cell responses against cytomegalovirus.PLoS Pathog. 2007 Aug 24;3(8):e123. doi: 10.1371/journal.ppat.0030123. PLoS Pathog. 2007. PMID: 17722980 Free PMC article.
-
Innate immunity regulates adaptive immune response: lessons learned from studying the interplay between NK and CD8+ T cells during MCMV infection.Med Microbiol Immunol. 2012 Nov;201(4):487-95. doi: 10.1007/s00430-012-0263-0. Epub 2012 Sep 11. Med Microbiol Immunol. 2012. PMID: 22965169 Free PMC article. Review.
-
MCMV avoidance of recognition and control by NK cells.Semin Immunopathol. 2014 Nov;36(6):641-50. doi: 10.1007/s00281-014-0441-9. Epub 2014 Aug 21. Semin Immunopathol. 2014. PMID: 25141793 Review.
Cited by
-
Yet another role for natural killer cells: cytotoxicity in immune regulation and viral persistence.Proc Natl Acad Sci U S A. 2012 Feb 7;109(6):1814-5. doi: 10.1073/pnas.1120528109. Epub 2012 Jan 31. Proc Natl Acad Sci U S A. 2012. PMID: 22308452 Free PMC article. No abstract available.
-
Roles of natural killer cells in antiviral immunity.Curr Opin Virol. 2016 Feb;16:15-23. doi: 10.1016/j.coviro.2015.10.008. Epub 2015 Nov 16. Curr Opin Virol. 2016. PMID: 26590692 Free PMC article. Review.
-
Chronic alcohol consumption exacerbates murine cytomegalovirus infection via impairing nonspecific and specific NK activation in mice.FASEB Bioadv. 2019 Jan;1(1):18-31. Epub 2018 Sep 14. FASEB Bioadv. 2019. PMID: 30911737 Free PMC article.
-
NK cells and their ability to modulate T cells during virus infections.Crit Rev Immunol. 2014;34(5):359-88. doi: 10.1615/critrevimmunol.2014010604. Crit Rev Immunol. 2014. PMID: 25404045 Free PMC article. Review.
-
Antiviral T cell response triggers cytomegalovirus hepatitis in mice.J Virol. 2012 Dec;86(23):12879-90. doi: 10.1128/JVI.01752-12. Epub 2012 Sep 19. J Virol. 2012. PMID: 22993151 Free PMC article.
References
-
- Andoniou CE, et al. 2005. Interaction between conventional dendritic cells and natural killer cells is integral to the activation of effective antiviral immunity. Nat. Immunol. 6:1011–1019 - PubMed
-
- Andrews DM, et al. 2005. Cross-talk between dendritic cells and natural killer cells in viral infection. Mol. Immunol. 42:547–555 - PubMed
-
- Andrews DM, Scalzo AA, Yokoyama WM, Smyth MJ, Degli-Esposti MA. 2003. Functional interactions between dendritic cells and NK cells during viral infection. Nat. Immunol. 4:175–181 - PubMed
-
- Arapovic J, Lenac Rovis T, Reddy AB, Krmpotic A, Jonjic S. 2009. Promiscuity of MCMV immunoevasin of NKG2D: m138/fcr-1 down-modulates RAE-1epsilon in addition to MULT-1 and H60. Mol. Immunol. 47:114–122 - PubMed
Publication types
MeSH terms
Substances
Grants and funding
LinkOut - more resources
Full Text Sources
Other Literature Sources
Research Materials

