. 2011 Dec 9;147(6):1295-308.
doi: 10.1016/j.cell.2011.10.044.

Selective ribosome profiling reveals the cotranslational chaperone action of trigger factor in vivo

Affiliations

Selective ribosome profiling reveals the cotranslational chaperone action of trigger factor in vivo

Eugene Oh et al. Cell. .

Abstract

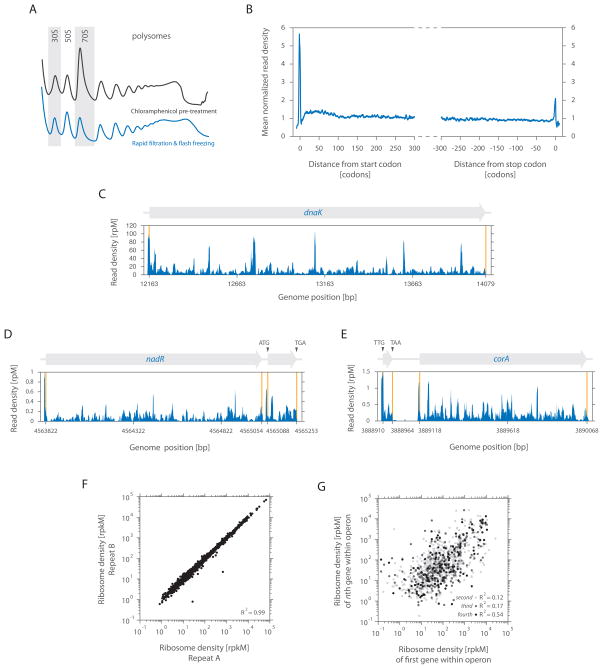
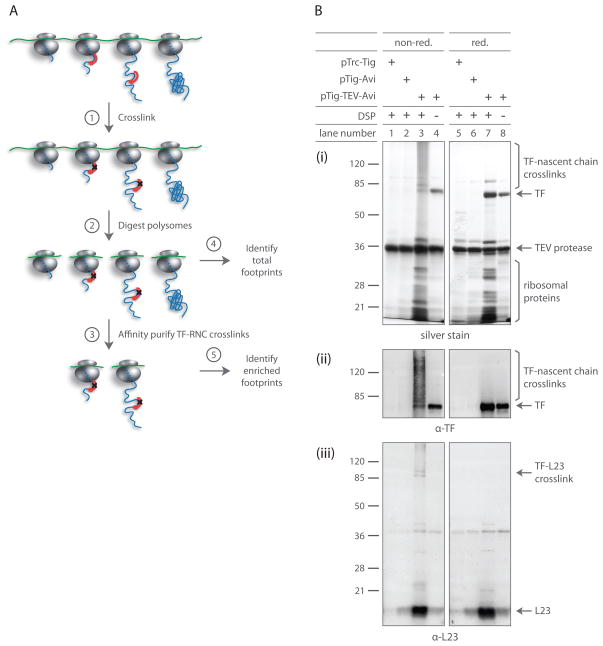
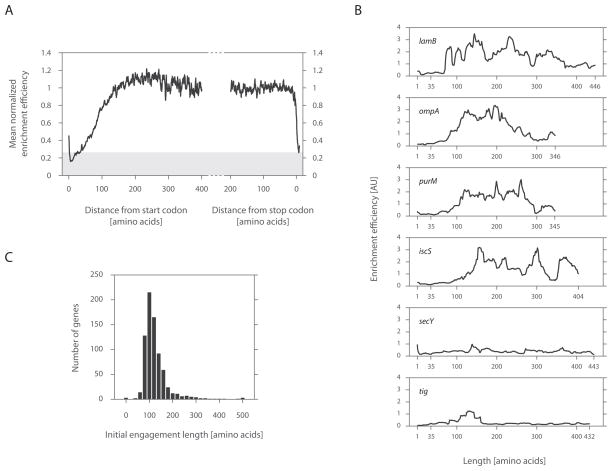
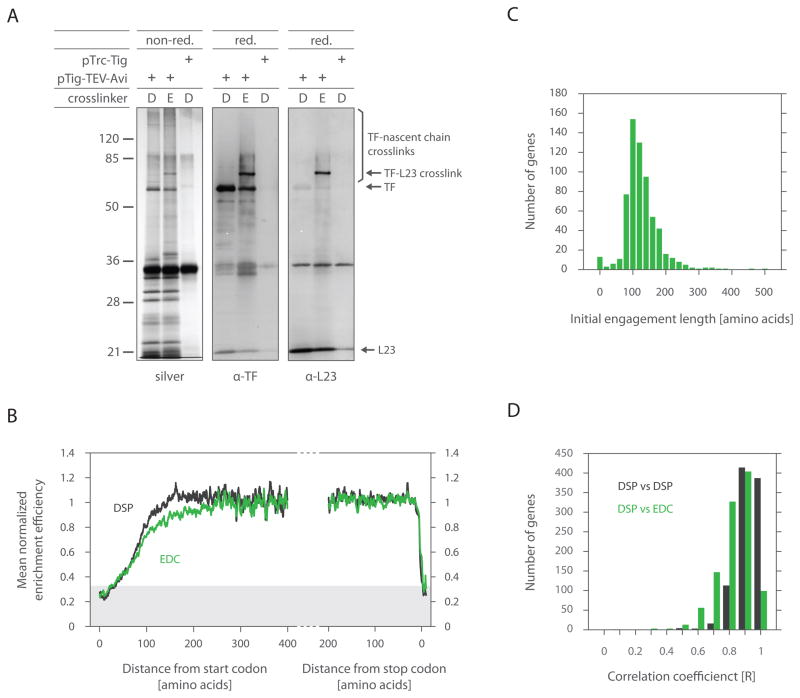
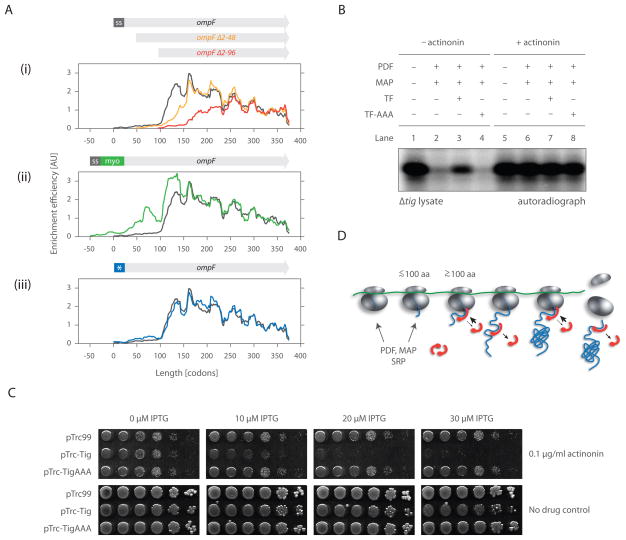
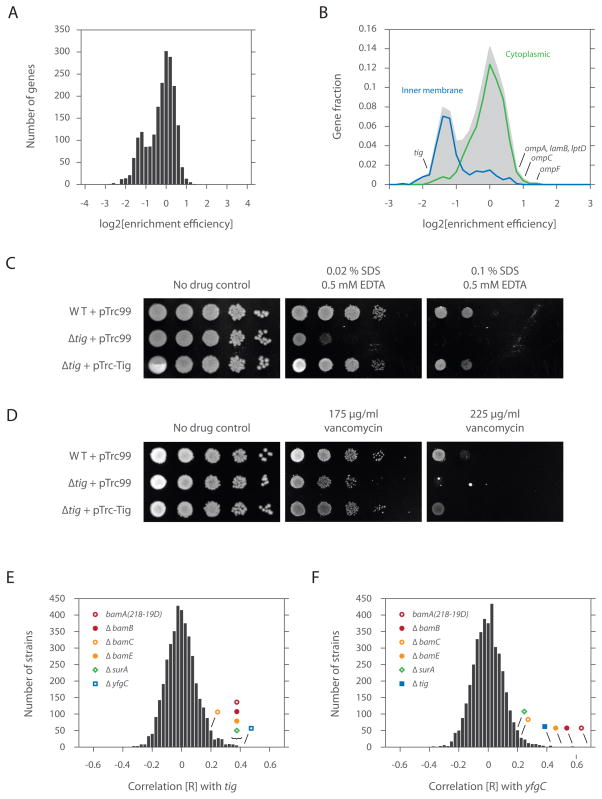
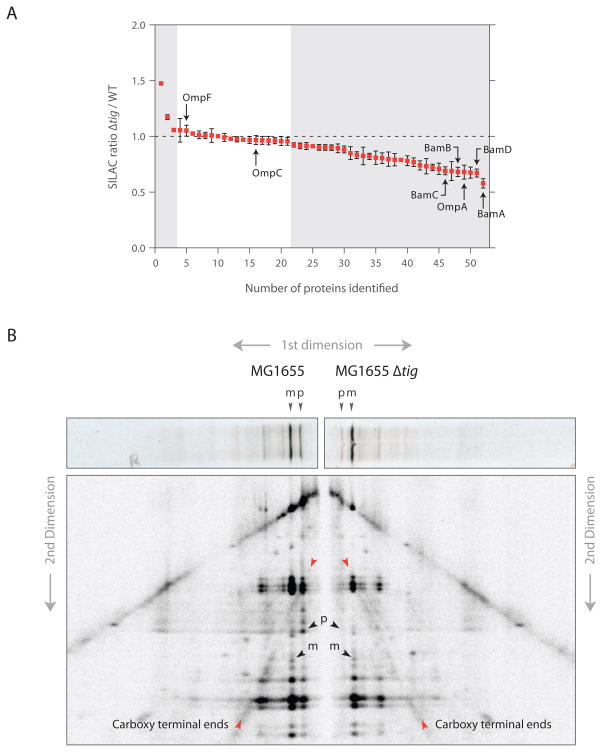
As nascent polypeptides exit ribosomes, they are engaged by a series of processing, targeting, and folding factors. Here, we present a selective ribosome profiling strategy that enables global monitoring of when these factors engage polypeptides in the complex cellular environment. Studies of the Escherichia coli chaperone trigger factor (TF) reveal that, though TF can interact with many polypeptides, β-barrel outer-membrane proteins are the most prominent substrates. Loss of TF leads to broad outer-membrane defects and premature, cotranslational protein translocation. Whereas in vitro studies suggested that TF is prebound to ribosomes waiting for polypeptides to emerge from the exit channel, we find that in vivo TF engages ribosomes only after ~100 amino acids are translated. Moreover, excess TF interferes with cotranslational removal of the N-terminal formyl methionine. Our studies support a triaging model in which proper protein biogenesis relies on the fine-tuned, sequential engagement of processing, targeting, and folding factors.


Figures

Figure 1
Figure 1. Characterizing prokaryotic translation by ribosome profiling of bacterial cells
(A) Translating ribosomes were extracted from cells (MC4100) either pre-treated with chloramphenicol (black trace) or collected by rapid filtration (blue trace). Polysomes were resolved by 10 to 55% (w/v) sucrose density gradients. (B) Meta-gene analysis of ribosome density as a function of position from fast filtered cells. Genes were aligned from either their start (left panel) or stop (right panel) codon and averaged across them [See Extended Experimental Procedures]. (C) Ribosome density of dnaK as a function of position. The density in reads per million (rpM) was corrected for the total number of reads that aligned to its coding sequence. (D) Example of a novel ORF starting at a non-canonical UUG codon. (E) Example of a newly identified canonical ORF. (F) Quantifying gene expression levels by ribosome profiling from fast filtered cells. Ribosome densities of two independent replicates were plotted for comparison. The density in reads per kilobase million (rpkM) is a measure of overall translation along each gene [See Extended Experimental Procedures]. (G) The ribosome density of the first gene in an operon was compared with the ribosome density of either the second, third or fourth gene in the same operon as indicated.
Figure 2
Figure 2. TF crosslinked RNCs can be isolated with high specificity
(A) Schematic for affinity purifying TF crosslinked RNCs: ➀ cells expressing epitope-tagged TF are harvested at mid-log phase, cryogenically lysed and chemically crosslinked. ➁ Polysomes digested with MNase yield footprint-containing monosomes. ➂ Digested monosomes are forced through a sucrose cushion, separating free TF molecules from those crosslinked to RNCs. TF crosslinked RNCs are affinity purified and eluted by cleaving TF with TEV protease. ➃ mRNA footprint fragments derived from all monosomes and ➄ those enriched through affinity purification are cloned into a cDNA library for deep sequencing analysis. (B) Gel analysis of DSP crosslinking and affinity purification. Δtig::kan cells expressing specified TF variants were harvested by centrifugation. Following cryogenic lysis, lysates were crosslinked with DSP as they thawed. TF-RNCs were affinity purified and eluted through TEV protease cleavage. Eluates were analyzed under both reducing and non-reducing conditions. Gels were either silver stained (i) or immunoblotted using antisera specific for TF (ii) or L23 (iii).
Figure 3
Figure 3. TF interaction propensity as a function of nascent chain length
(A) Meta-gene enrichment efficiency derived as a function of ribosome position. Meta-gene ribosome densities (described in Figure 1B) were each computed for footprints derived from TF enriched RNCs and those from the total monosome pool. Ratios between these profiles were taken along indicated positions. Background signal is shaded in gray, corresponding to the enrichment efficiency at codon 30, a length that should be inaccessible to soluble factors. (B) Individual enrichment efficiencies plotted as a function of nascent chain length. Characteristic examples of cytoplasmic (IscS and PurM), inner membrane (SecY) and outer membrane (LamB and OmpF) proteins are shown. (C) A histogram of the initial position, at which TF engages nascent chains.
Figure 4
Figure 4. Ribosome recruitment of TF occurs at the same time as nascent chain binding
(A) Gel analysis of DSP and EDC crosslinking and affinity purification. Δtig::kan cells were processed as before (Figure 2), but treated with DSP (D) or EDC (E). Resulting eluates were resolved by SDS-PAGE under both reducing (red.) and non-reducing (non-red.) conditions. EDC crosslinks are irreversible under reducing conditions unlike DSP. Gels from non-reduced samples were silver stained (i), while reduced samples were immunoblotted using antisera specific either for TF (ii) or L23 (iii). (B) The same test was performed as in Figure 3A, except cells were harvested by rapid filtration followed by fast freezing. Cryogenically pulverized cells were crosslinked with either EDC or DSP. (C) The same test was performed as in Figure 3C, except cells were harvested by filtration (as in Figure 4B) and TF-RNCs were stabilized by EDC crosslinking. (D) Gene by gene correlation of TF binding profiles for DSP replicates and DSP compared to EDC.
Figure 5
Figure 5. TF does not engage the N-terminal end of nascent chains in vivo as they emerge from the ribosome
(A) Individual enrichment efficiencies of ompF variants compared with wild-type ompF. (B) Cell-free coupled transcription/translation reactions initiated by non-stalled barnase. 5 μM each of either TF or TF-AAA (deficient in ribosome binding) and 2 μM each of both PDF and MAP were supplemented prior to translation initiation where indicated. Extracts treated with actinonin (lanes 5–8), an inhibitor of PDF, were used to assess overall levels of barnase synthesis. Reactions were quenched by TCA precipitation and visualized using SDS-PAGE and autoradiography. (C) TF overexpression can interfere with N-terminal processing. MC4100 ΔacrA::kan cells transformed with pTrc99 (empty vector), pTrc-Tig or pTrc-TigAAA were spotted as 1:10 serial dilutions on LB plates containing 100 μg/ml of ampicillin and indicated concentrations of IPTG and actinonin. 10 μM IPTG induces TF from pTrc-Tig near endogenous levels (Kramer et al., 2004), thus overall expression of TF is increased roughly two-fold (from both the plasmid and endogenous locus). (D) A model for the dynamic binding of trigger factor to ribosomes and nascent chains. Interaction between TF and the ribosome is limited early on translation (i.e. before the nascent chain emerges from the exit tunnel). TF fully engages the ribosome and nascent chain not before ~100 amino acids are translated. After release from the nascent chain, TF can re-bind, but each polypeptide is, on average, bound by only one, maximal two TF molecules at a time. Following translation termination, TF may stay associated with the released polypeptide, guiding further folding steps.
Figure 6
Figure 6. TF chaperones outer membrane β-barrel protein biosynthesis
(A) A histogram of the overall enrichment efficiency (defined as the ratio of the enriched ribosome footprint density to the total ribosome footprint density). Nascent chains that interact well with TF show positive log values while those that interact poorly with the chaperone show negative log values. (B) A histogram comprising the overall enrichment efficiency of each nascent chain for those with known GO (gene ontology) annotations based on cellular localization (i.e. cytoplasm, GO=0005737; inner membrane, GO=0019866; outer membrane, GO=0009279). The number of genes was represented as a fraction of the total, with the shaded area reflecting the total number. (C) Growth analyses of cells expressing or lacking TF. 1:10 serial dilutions (horizontal dimension) of indicated strains (vertical dimension) were spotted on LB plates containing 10 μM IPTG, 50 μg/ml of ampicillin and specified levels of SDS/EDTA. (D) Same as Figure 6C, but dilutions were spotted on LB plates containing 10 μM IPTG, 50 μg/ml of ampicillin and specified levels of vancomycin. (E) Chemical sensitivities of BW25113 Δtig cells correlated with those of more than 3900 bacterial mutants (Nichols et al., 2011) and represented as a histogram of correlation [R] values. (F) Same as Figure 6E, but for BW25113 ΔyfgC cells.
Figure 7
Figure 7. TF absence causes a broad reduction in outer membrane protein levels and shifts the mode of translocation
(A) Quantifcation of proteins from isolated outer membranes using SILAC. The SILAC ratio (Δtig/wild-type) was calculated for all outer membrane proteins identified with at least three peptides. (B) 2D gel assay for monitoring translocation of newly synthesized LamB. Wild-type and Δtig::kan cells were pulse-labeled with 35S-methionine for 30 s and quenched using 5% TCA. LamB chains were immunoprecipitated and resolved by 12% SDS-PAGE (first dimension). Gel slices were excised, digested in gel with V8 protease and resolved by 15% SDS-PAGE (second dimension). Red arrows highlight C-terminal fragments that converge either to the precursor (p) as seen for wild-type cells or mature (m) form as seen for Δtig cells (black arrows).

Similar articles

Cited by

References

    1. Agashe VR, Guha S, Chang HC, Genevaux P, Hayer-Hartl M, Stemp M, Georgopoulos C, Hartl FU, Barral JM. Function of trigger factor and DnaK in multidomain protein folding: increase in yield at the expense of folding speed. Cell. 2004;117:199–209. - PubMed
    1. Albanèse V, Yam AYW, Baughman J, Parnot C, Frydman J. Systems analyses reveal two chaperone networks with distinct functions in eukaryotic cells. Cell. 2006;124:75–88. - PubMed
    1. Ball LA, Kaesberg P. Cleavage of the N-terminal formylmethionine residue from a bacteriophage coat protein in vitro. J Mol Biol. 1973;79:531–537. - PubMed
    1. Ban N, Nissen P, Hansen J, Moore PB, Steitz TA. The complete atomic structure of the large ribosomal subunit at 2.4 A resolution. Science. 2000;289:905–920. - PubMed
    1. Baram D, Pyetan E, Sittner A, Auerbach-Nevo T, Bashan A, Yonath A. Structure of trigger factor binding domain in biologically homologous complex with eubacterial ribosome reveals its chaperone action. Proc Natl Acad Sci USA. 2005;102:12017–12022. - PMC - PubMed

Publication types

MeSH terms

Associated data