Polycomb-repressed genes have permissive enhancers that initiate reprogramming
- PMID: 22153073
- PMCID: PMC3240866
- DOI: 10.1016/j.cell.2011.10.040
Polycomb-repressed genes have permissive enhancers that initiate reprogramming
Abstract
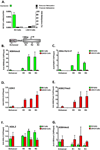
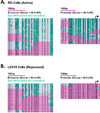
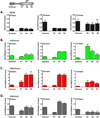
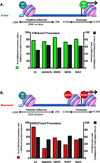
Key regulatory genes, suppressed by Polycomb and H3K27me3, become active during normal differentiation and induced reprogramming. Using the well-characterized enhancer/promoter pair of MYOD1 as a model, we have identified a critical role for enhancers in reprogramming. We observed an unexpected nucleosome-depleted region (NDR) at the H3K4me1-enriched enhancer at which transcriptional regulators initially bind, leading to subsequent changes in the chromatin at the cognate promoter. Exogenous Myod1 activates its own transcription by binding first at the enhancer, leading to an NDR and transcription-permissive chromatin at the associated MYOD1 promoter. Exogenous OCT4 also binds first to the permissive MYOD1 enhancer but has a different effect on the cognate promoter, where the monovalent H3K27me3 marks are converted to the bivalent state characteristic of stem cells. Genome-wide, a high percentage of Polycomb targets are associated with putative enhancers in permissive states, suggesting that they may provide a widespread avenue for the initiation of cell-fate reprogramming.
Copyright © 2011 Elsevier Inc. All rights reserved.
Figures


Similar articles
-
The role of MyoD1 and histone modifications in the activation of muscle enhancers.Epigenetics. 2013 Aug;8(8):778-84. doi: 10.4161/epi.25441. Epub 2013 Jun 27. Epigenetics. 2013. PMID: 23880568 Free PMC article.
-
Enhancer identification in mouse embryonic stem cells using integrative modeling of chromatin and genomic features.BMC Genomics. 2012 Apr 26;13:152. doi: 10.1186/1471-2164-13-152. BMC Genomics. 2012. PMID: 22537144 Free PMC article.
-
Genome-wide identification of enhancers in skeletal muscle: the role of MyoD1.Genes Dev. 2012 Dec 15;26(24):2763-79. doi: 10.1101/gad.200113.112. Genes Dev. 2012. PMID: 23249738 Free PMC article.
-
Enhancers: emerging roles in cell fate specification.EMBO Rep. 2012 Apr 10;13(5):423-30. doi: 10.1038/embor.2012.52. EMBO Rep. 2012. PMID: 22491032 Free PMC article. Review.
-
Functions of Polycomb Proteins on Active Targets.Epigenomes. 2020 Aug 17;4(3):17. doi: 10.3390/epigenomes4030017. Epigenomes. 2020. PMID: 34968290 Free PMC article. Review.
Cited by
-
Epigenetic memory contributing to the pathogenesis of AKI-to-CKD transition.Front Mol Biosci. 2022 Sep 21;9:1003227. doi: 10.3389/fmolb.2022.1003227. eCollection 2022. Front Mol Biosci. 2022. PMID: 36213117 Free PMC article. Review.
-
Effect of Interaction between Chromatin Loops on Cell-to-Cell Variability in Gene Expression.PLoS Comput Biol. 2016 May 6;12(5):e1004917. doi: 10.1371/journal.pcbi.1004917. eCollection 2016 May. PLoS Comput Biol. 2016. PMID: 27153118 Free PMC article.
-
Bivalent Regions of Cytosine Methylation and H3K27 Acetylation Suggest an Active Role for DNA Methylation at Enhancers.Mol Cell. 2016 May 5;62(3):422-431. doi: 10.1016/j.molcel.2016.03.033. Mol Cell. 2016. PMID: 27153539 Free PMC article.
-
Current and Emerging Technologies for the Analysis of the Genome-Wide and Locus-Specific DNA Methylation Patterns.Adv Exp Med Biol. 2022;1389:395-469. doi: 10.1007/978-3-031-11454-0_16. Adv Exp Med Biol. 2022. PMID: 36350519
-
The histone modification H3K4me3 is altered at the ANK1 locus in Alzheimer's disease brain.Future Sci OA. 2021 Feb 9;7(4):FSO665. doi: 10.2144/fsoa-2020-0161. Future Sci OA. 2021. PMID: 33815817 Free PMC article.
References
-
- Asakura A, Lyons GE, Tapscott SJ. The regulation of MyoD gene expression: conserved elements mediate expression in embryonic axial muscle. Dev Biol. 1995;171:386–398. - PubMed
-
- Azuara V, Perry P, Sauer S, Spivakov M, Jorgensen HF, John RM, Gouti M, Casanova M, Warnes G, Merkenschlager M, et al. Chromatin signatures of pluripotent cell lines. Nat Cell Biol. 2006;8:532–538. - PubMed
-
- Barski A, Cuddapah S, Cui K, Roh TY, Schones DE, Wang Z, Wei G, Chepelev I, Zhao K. High-resolution profiling of histone methylations in the human genome. Cell. 2007;129:823–837. - PubMed
-
- Bernstein BE, Mikkelsen TS, Xie X, Kamal M, Huebert DJ, Cuff J, Fry B, Meissner A, Wernig M, Plath K, et al. A bivalent chromatin structure marks key developmental genes in embryonic stem cells. Cell. 2006;125:315–326. - PubMed
Publication types
MeSH terms
Substances
Grants and funding
LinkOut - more resources
Full Text Sources
Miscellaneous

