. 2011 Dec 9;44(5):745-58.
doi: 10.1016/j.molcel.2011.09.019.

Reconsidering movement of eukaryotic mRNAs between polysomes and P bodies

Affiliations

Reconsidering movement of eukaryotic mRNAs between polysomes and P bodies

Joshua A Arribere et al. Mol Cell. .

Abstract

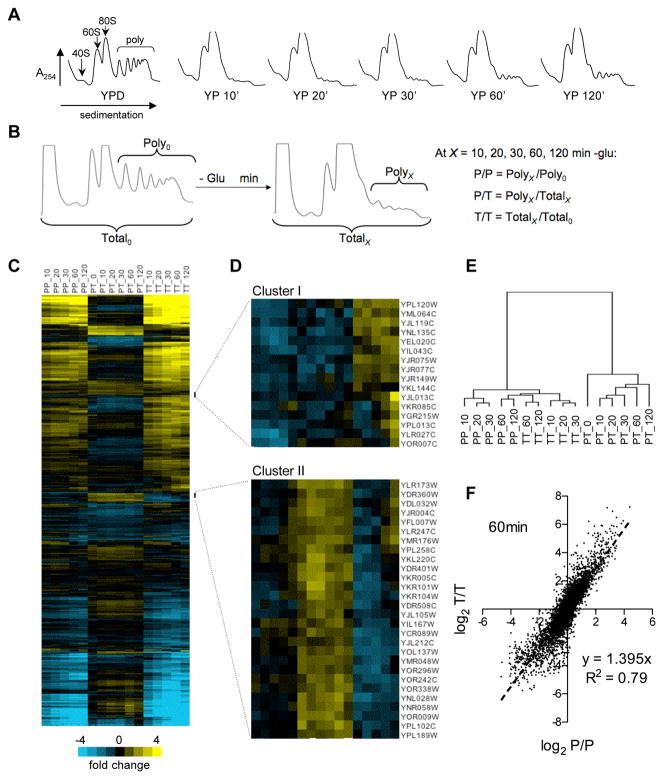
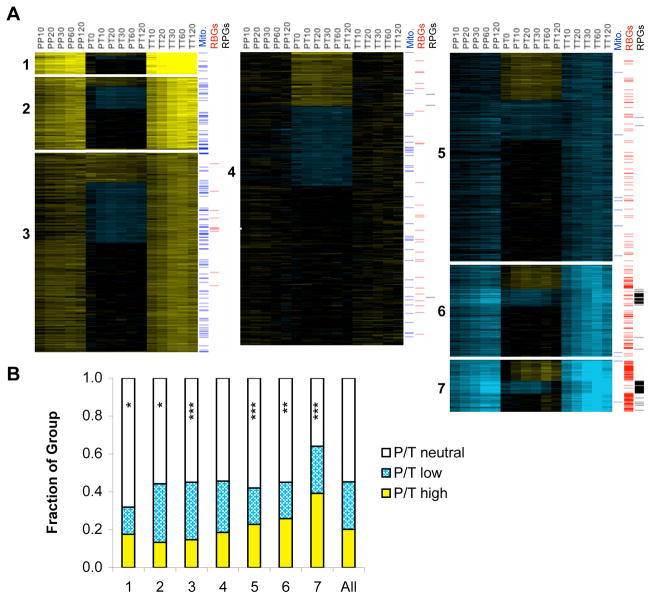
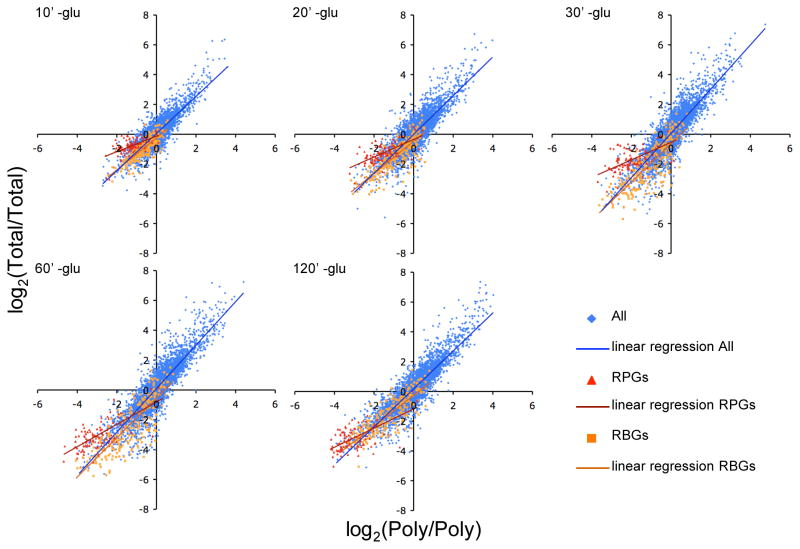
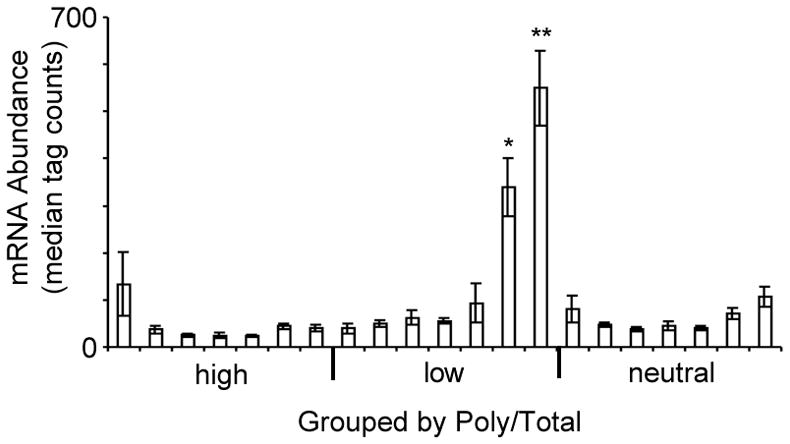
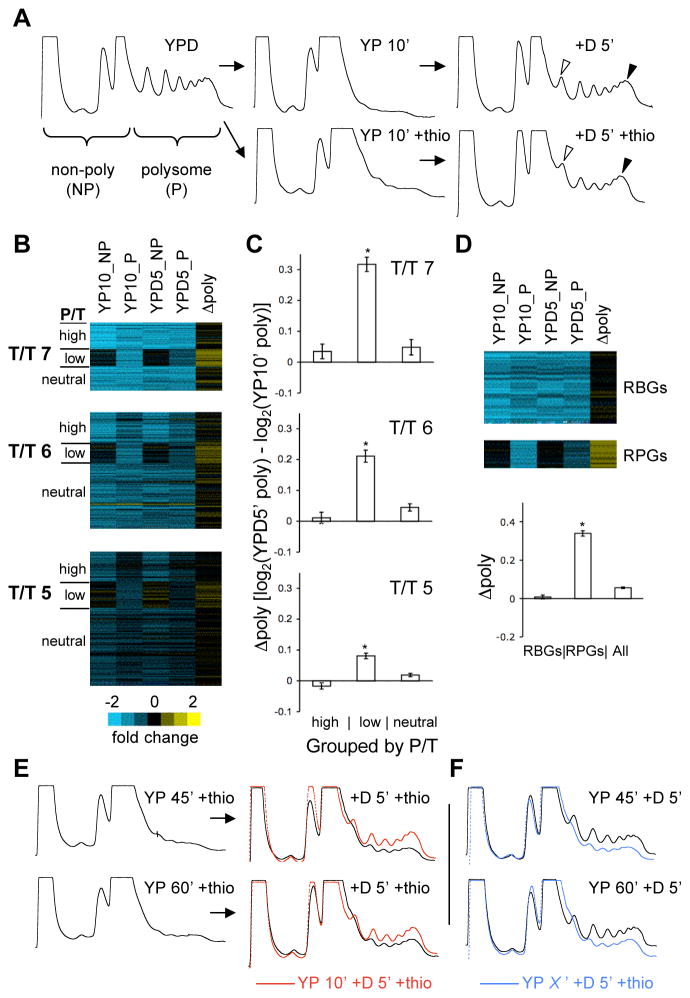
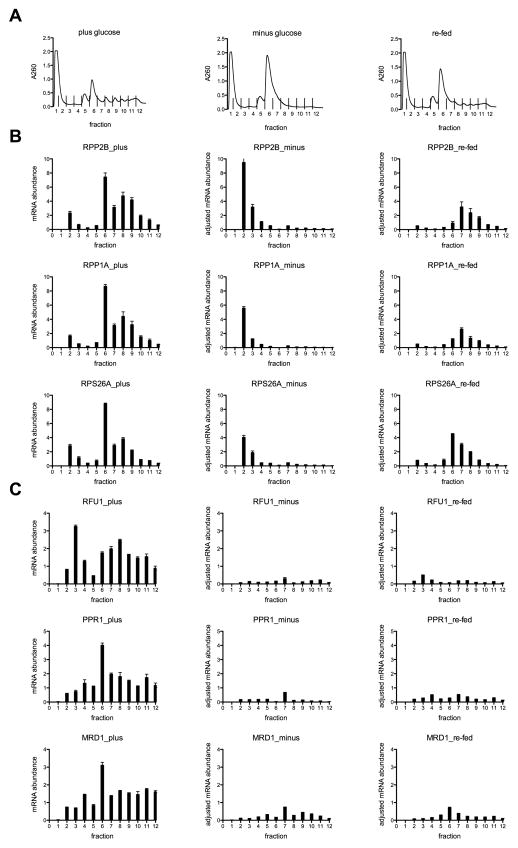
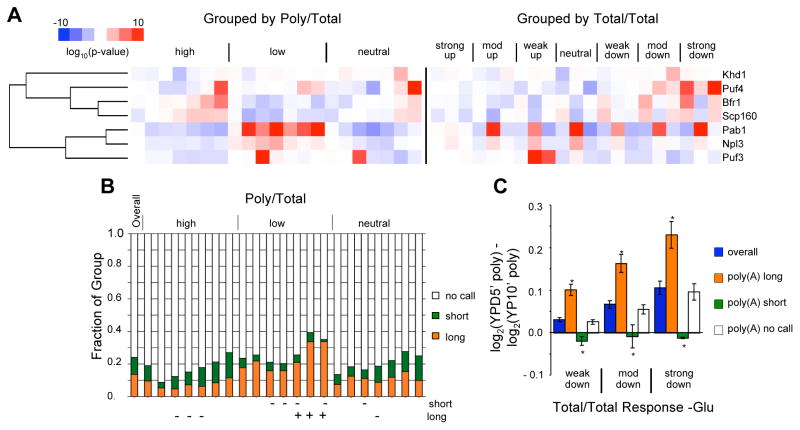
Cell survival in changing environments requires appropriate regulation of gene expression, including posttranscriptional regulatory mechanisms. From reporter gene studies in glucose-starved yeast, it was proposed that translationally silenced eukaryotic mRNAs accumulate in P bodies and can return to active translation. We present evidence contradicting the notion that reversible storage of nontranslating mRNAs is a widespread and general phenomenon. First, genome-wide measurements of mRNA abundance, translation, and ribosome occupancy after glucose withdrawal show that most mRNAs are depleted from the cell coincident with their depletion from polysomes. Second, only a limited subpopulation of translationally repressed transcripts, comprising fewer than 400 genes, can be reactivated for translation upon glucose readdition in the absence of new transcription. This highly selective posttranscriptional regulation could be a mechanism for cells to minimize the energetic costs of reversing gene-regulatory decisions in rapidly changing environments by transiently preserving a pool of transcripts whose translation is rate-limiting for growth.


Figures

Figure 1
Figure 1. Regulation of transcription and translation in glucose-starved cells
(A) Polysome profiles of yeast starved for glucose by transfer from YPD to YP media. (B) Schematic of the microarray comparisons performed. (C) Time-resolved gene expression profiles resulting from the comparisons shown in B. Ratio values are indicated by color scale and represent the average of eight measurements (2 biological replicates × 2 technical replicates × 2 probes per gene). Rows (genes) are ordered according to the results of hierarchical clustering based on Euclidean distance with P/T values assigned twice the weight of P/P or T/T. (D) Unusual gene clusters for which polysomal mRNA abundance diverged from total mRNA abundance. (E) P/T ratios are more similar to each other than to T/T or P/T for any time point. Branch lengths represent Spearman rank correlation coefficients between data columns from C. (F) Total mRNA abundance changes parallel and exceed polysomal mRNA abundance changes after 60 minutes minus glucose. Dotted line indicates best fit by linear regression. See also Figures S1 and S2.
Figure 2
Figure 2. Ribosome occupancy and mRNA abundance are divergently regulated
(A) The seven groups of genes identified by k-means clustering of T/T ratios include different proportions of genes with high, low, or neutral P/T ratios. Data and color scale are as in Figure 1C, with rows (genes) re-ordered to highlight the differences in ribosome occupancy (P/T) among genes with similar glucose-withdrawal induced changes in total mRNA abundance (T/T). P/P ratios are displayed for comparison but were not considered during clustering. Selected GO categories enriched in specific P/T groups are indicated. (“mito.” – mitochondrial; “RBG” – ribosome biogenesis; “RPG” – ribosomal protein gene) (B) P/T ratios are not equally distributed among T/T groups. Asterisks (*) indicate significant deviations from the distributions predicted by chance (Fisher’s exact test 2-tailed p-value, * < 0.05; ** < 0.005; *** < 0.0005). See also Figure S3.
Figure 3
Figure 3. RPGs and RBGs differ in their post-transcriptional responses to glucose withdrawal
Kinetics of total mRNA abundance changes compared to polysomal mRNA abundance changes following glucose withdrawal. RPG mRNAs (red triangles) were preferentially depleted from the polysomal RNA pool compared to the total mRNA pool at early times. RBGs (gold squares), like most genes (blue diamonds), disappeared from the totals in concert with their loss from polysomes. After 120 minutes –glucose, the RPGs T/T versus P/P ratios more closely resembled the population as a whole, indicating a loss of a non-polysomal pool of mRNA. The results of linear regression analysis for each group of genes are shown by color-coded lines. See also Figure S4.
Figure 4
Figure 4. Highly expressed mRNAs are preferentially retained in the non-translating pool
Mean mRNA abundance by group, as determined for each ORF by tag counts from next-generation sequencing of mRNA from cells grown in rich media (Nagalakshmi et al., 2008). Groups are as in Fig. 2A. The two T/T groups that were strongly decreased following glucose withdrawal and also showed low P/T ratios are comprised of significantly more abundant mRNAs (p < 0.05) than all other groups. Significance was assessed by Student’s t-test with Bonferroni correction. Within each P/T classification, groups are arranged from left to right from highest T/T ratio to lowest. Error bars indicate standard error of the mean (SEM).
Figure 5
Figure 5. Translational resurrection is restricted to a subset of genes for a limited time
(A) Polysome profiles of cells subjected to 10 minutes of glucose starvation followed by 5 minutes of glucose repletion in the presence (+T) or absence of thiolutin to inhibit new transcription. Thiolutin treatment slightly reduced polysome recovery. Note the relative heights of the disome (open arrowhead) and polysome (filled arrowhead) peaks and the widths of the monosome peaks ± thio. Analytical polysome assays (A, E, F) were repeated 2–4 times. Representative traces are shown for each. (B) Ratio values shown by color scale from microarray analysis of non-polysomal (NP) and polysomal (P) mRNA from cells starved for 10 minutes (YP 10′ +thio) or starved and re-fed for 5 minutes (+D 5′ +thio). Polysomal mRNA from YPD cultures served as the reference sample for each array. Genes are organized according to T/T and P/T groups from Figure 2. Group 5 is shown at 50% vertical scale. Genes that showed low P/T ratios in starved cells were less depleted from the non-polysomal fraction than genes with high or neutral P/T ratios and showed greater mobilization into polysomes upon re-feeding. “Δpoly” values were derived from the ratio of ratios (YPD5_P versus YP10_P). (C) Graphs show quantification of the Δpoly values from B. Error bars in C and D indicate SEM. Asterisks (*) indicate Student’s t-test p-value < 0.0001. (D) RPGs as a class preferentially recovered in polysomes upon glucose re-addition. “All” = all genes from T/T 5–7. (E) Prolonged glucose starvation in the absence of new transcription leads to reduced polysome recovery upon re-feeding. Cells were starved for 45 (top row) or 60 (bottom row) minutes in the presence of thiolutin before re-feeding for 5 minutes. Polysome profiles of recovery (+D 5′) after only 10 minutes –glucose +thio are overlaid for comparison (red lines). (F) New transcription contributes substantially to polysome recovery after prolonged starvation. Polysome profiles of recovery (+D 5′) after 45′ or 60′ of starvation are shown in black. Polysome recovery after starvation for 45 or 60 minutes +thiolutin is shown (blue lines) for comparison. See also Figure S5.
Figure 6
Figure 6. Quantitative RT-PCR validation of select genes’ mRNA abundance in polysome fractions following glucose starvation and re-feeding
(A) Polysome gradient fractions from plus glucose (left), starved (10 minutes minus glucose, with thiolutin, center), and re-fed (10 minutes minus glucose and 5 minutes plus glucose, with thiolutin, right). (B, C) (left) mRNA abundance per fraction, relative to 1/12th input and normalized to Fluc dope-in control RNA. (center, right) Adjusted mRNA abundance per fraction determined by qRT-PCR comparison with plus glucose fractions, shown on the same scale as plus glucose samples. Error bars indicate standard deviation of the mean of three replicates.
Figure 7
Figure 7. Resurrection-competent mRNAs associate with Pab1 and have longer poly(A) tails
(A) Comparison of mRNA behavior following glucose withdrawal (7 T/T groups × 3 P/T groups) with RBP association profiles [Hogan et al.]. RBP target lists (rows) were clustered according to p-values for enrichment or de-enrichment within a given mRNA regulatory group. P-values were obtained using Fisher’s exact test with Bonferroni correction for multiple hypothesis testing. Columns are grouped by P/T (left) or T/T (right) similarity, ordered from left to right: high, low, neutral, and from most increased to most decreased T/T. Note that the ‘strong down’ T/T category includes genes that are not strongly reduced until after 60 minutes, although they are strongly reduced in the P/P at earlier times. (B) mRNAs with low P/T ratios have longer poly(A) tails as a group than mRNAs with high P/T. This effect is most pronounced for the group of genes that was most strongly down regulated (T/T) following glucose withdrawal. Poly(A) tail lengths were determined genome-wide and classified as ‘long’, ‘short’, or ‘no call’ (neither long nor short compared to most genes) [Beilharz and Preiss]. + and − indicate the presence of significantly too many or too few long- or short-tailed mRNAs within each of the 21 mRNA groups. Significance was assessed by Fisher’s exact test (Bonferroni corrected p-value < 0.01). (C) mRNAs with long poly(A) tails show greater capacity for translational recovery upon glucose re-addition than mRNAs with short or average length tails. Polysome recovery was assessed as described in Figure 5. Error bars indicate SEM. Asterisks (*) indicate p < 0.05 (Bonferroni corrected, Student’s t-test for difference compared to all other transcripts in the same T/T group). See also Figures S6 and S7.

Similar articles

Cited by

References

    1. Anderson P, Kedersha N. RNA granules. J Cell Biol. 2006;172:803–808. - PMC - PubMed
    1. Arava Y, Wang Y, Storey JD, Liu CL, Brown PO, Herschlag D. Genome-wide analysis of mRNA translation profiles in Saccharomyces cerevisiae. Proc Natl Acad Sci USA. 2003;100:3889–3894. - PMC - PubMed
    1. Ashe MP, De Long SK, Sachs AB. Glucose depletion rapidly inhibits translation initiation in yeast. Mol Biol Cell. 2000;11:833–848. - PMC - PubMed
    1. Beilharz TH, Preiss T. Widespread use of poly(A) tail length control to accentuate expression of the yeast transcriptome. RNA. 2007;13:982–997. - PMC - PubMed
    1. Blake WJ, KAErn M, Cantor CR, Collins JJ. Noise in eukaryotic gene expression. Nature. 2003;422:633–637. - PubMed

Publication types

MeSH terms

Associated data