. 2012 Jan 17;125(2):364-74.
doi: 10.1161/CIRCULATIONAHA.111.061986. Epub 2011 Dec 5.

Extramedullary hematopoiesis generates Ly-6C(high) monocytes that infiltrate atherosclerotic lesions

Affiliations

Extramedullary hematopoiesis generates Ly-6C(high) monocytes that infiltrate atherosclerotic lesions

Clinton S Robbins et al. Circulation. .

Abstract

Background: Atherosclerotic lesions are believed to grow via the recruitment of bone marrow-derived monocytes. Among the known murine monocyte subsets, Ly-6C(high) monocytes are inflammatory, accumulate in lesions preferentially, and differentiate. Here, we hypothesized that the bone marrow outsources the production of Ly-6C(high) monocytes during atherosclerosis.

Methods and results: Using murine models of atherosclerosis and fate-mapping approaches, we show that hematopoietic stem and progenitor cells progressively relocate from the bone marrow to the splenic red pulp, where they encounter granulocyte macrophage colony-stimulating factor and interleukin-3, clonally expand, and differentiate to Ly-6C(high) monocytes. Monocytes born in such extramedullary niches intravasate, circulate, and accumulate abundantly in atheromata. On lesional infiltration, Ly-6C(high) monocytes secrete inflammatory cytokines, reactive oxygen species, and proteases. Eventually, they ingest lipids and become foam cells.

Conclusions: Our findings indicate that extramedullary sites supplement the hematopoietic function of the bone marrow by producing circulating inflammatory cells that infiltrate atherosclerotic lesions.


Conflict of interest statement

Conflict of Interest Disclosures: None

Figures

Figure 1
Figure 1
Splenic myeloid cells infiltrate atherosclerotic lesions. A. Immunofluorescence (IF) of CD11b cells (red) in spleens of C57BL/6 (wt) and apoE−/− mice consuming a high cholesterol diet (HCD) for 20 weeks. Data show that the red pulp myeloid component enlarges during atherosclerosis and pushes the white pulp clusters away from each other. B. Size of the monocyte reservoir in apoE−/− mice consuming a chow diet for 20 weeks, apoE−/− mice consuming HCD 20 weeks, and apoE−/− mice consuming HCD for 20 weeks and then injected with clodronate liposomes 1 day prior (n = 2–10). C. Presence of CD45.1+ cells in the blood of CD45.2+ mice that received CD45.1+ spleens by transplantation. D. Spleen transplantation from CD45.1 apoE−/− donors consuming HCD to CD45.2 apoE−/− recipients. Data show direct accumulation and differentiation of splenic Ly-6Chigh monocytes in aortic lesions in 1 day. One of 11 representative experiments is shown. E. Spleen transplantation from CD45.1 apoE−/− donors consuming chow and from CD45.1 apoE−/− donors consuming HCD and then injected with clodronate liposomes. Data show negligible accumulation of splenic monocytes in aortic lesions in these controls. F. IF on the aortic root with antibodies against CD45.1 (green), CD11b (red) and the merge of the two (yellow). DAPI depicts nuclei (blue). Arrows point to CD11b+ cells of splenic origin. For all flow cytometric plots the ticks represent 0, 102, 103, 104, 105 mean fluorescence units (MFI), except for axes labled “cell no.” or “SSC” where the ticks represent 0, 50K, 100K, 150K, 200K and 250K MFI.
Figure 2
Figure 2
Splenic cells are inflammatory and shape lesional evolution. A. Spleen transplantation from CD45.1+ apoE−/− to CD45.2+ apoE−/− mice. Expression of pro- IL-1β on monocytes and macrophages directly ex vivo (i.e., unstimulated). Contour plots show pro- IL-1β expression gated on lesional monocytes and macrophages of splenic (CD45.1+, red) or other source (i.e., bone marrow) (CD45.2+, blue) origin. The control density plots (black) represent isotype controls. B. Contour plots show protease activity gated on lesional monocytes and macrophages of splenic (CD45.1, red) or other source (i.e., bone marrow) (CD45.2+, blue) origin. The control density plots (black) are gated on all leukocytes. C. Contour plots show presence of reactive oxygen species on lesional monocytes and macrophages of splenic (CD45.1+, red) or other source (i.e., bone marrow) (CD45.2+, blue) origin. The control density plots (black) are gated on cells that did not receive the probe. Representative plots in A–C of at least 2 independent experiments are shown. D. Spleen transplantation for 10 days. Data show IF on the aortic root with antibodies against CD45.1 (splenic cells, green), F4/80 (macrophages, red), and the merge (yellow). DAPI depicts nuclei (blue). Arrows point to F4/80+ cells of splenic origin. E. Oil red O (ORO) staining on the same section as in D shows colocalization of ORO with spleen-derived macrophages. F. Splenectomy of apoE−/− HCD mice for 12 weeks. Data show enumeration of total lesion size using H&E. G. Representative Mac3 expression on aortic root sections in control and splenectomized apoE−/− HCD mice. H. Enumeration of CD11b, ORO, F4/80, and Mac3 areas on aortic root sections in control and splenectomized apoE−/− HCD mice. I. Enumeration of the necrotic core size in the same groups as above. J. Representative ORO staining in the same groups as above. K. Flow cytometry of digested aortas. Dot plots show cellular distribution from control and splenectomized apoE−/− HCD mice. The monocyte/macrophage gate is shown. L. Total number of monocytes and macrophages/DC enumerated by flow cytometry (means ± SEM, n = 5–11) *P< 0.05.
Figure 3
Figure 3
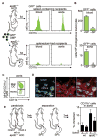
The spleen contains proliferating myeloid cell progenitors that give rise to their progeny in vivo. A. CFU-GM shows colony formation in spleens of wt and apoE−/− HCD mice (means ± SEM, n = 4). *P< 0.05. B. Phenotypic analysis of granulocyte and macrophage progenitors (GMP) in spleens of wt and apoE−/− HCD mice. C, Enumeration of GMP in spleens and bone marrow of apoE−/− mice fed HCD for up to 30 weeks. Linear regression was performed. D. Adoptive transfer of GFP+ GMP to wt and apoE−/− HCD mice. Data show GFP cells in spleens 5 days after transfer. E. Enumeration of data above. Data show the fold increase from wt to apoE−/− HCD mice of adoptively transferred GFP+ cells in the bone marrow (BM) and spleen (data shown are pooled from two independent experiments). F. CD45.1+ spleens from apoE−/− HCD mice were transplanted to asplenic CD45.2+ apoE−/− HCD mice for 10 days. Data show chimerism of GMP in spleens 10 days after transplantation. G. Cell cycle analysis of CD45.1+and CD45.2+ GMP in transplanted spleens shown in G. Numbers indicate percentage of cells in S/G2/M phase (means ± SEM, n = 4). H. Monocyte accumulation in aortic tissue of the mice described in F and G. Representative of 2 independent experiments are shown.
Figure 4
Figure 4
Splenic monocytopoiesis gives rise to lesion-infiltrating monocytes. A. Adoptive transfer of GFP+ GMP to apoE−/− HCD mice with or without their spleen. Data show GFP+ CD11b cells retrieved from blood and aorta 5 days after transfer. B. Enumeration of data above (data shown are pooled from two independent experiments). *P< 0.05. C. Differentiation of GFP+GMPs into lesional macrophages. A representative contour plot shows that GFP+ cells that were injected as GMP have accumulated in lesions as monocytes and matured to macrophages. D. CD45.1 GMP were adoptively transferred to apoE−/− HCD mice and the aorta was harvested 5 days after transfer. A representative pictograph shows CD45.1 (GMP-derived, green), F4/80 (macrophages, red) and the merge (yellow) in the intima. E. CD45.1 and CD45.2 wt or apoE−/− HCD mice were joined in parabiosis for 3 weeks, separated, splenectomized (or not) and assessed for chimerism 2 weeks later. Data show chimerism for CD11b+ cells in the aorta (means ± SEM, n = 4).
Figure 5
Figure 5
GM-CSF and IL-3 control survival and proliferation of myeloid progenitors and progeny in atherosclerosis. A. Enumeration of GM-CSF and IL-3-producing cells by flow cytometry in the spleen and bone marrow in wt and apoE−/− HCD mice. Data show preferential increase of GM-CSF and IL-3 producing cells in the spleen (means ± SEM, n = 5). *P< 0.05. B. Presence of GM-CSF and IL-3-producing cells in the red pulp of wt and apoE−/− HCD mice. C. Effect of IL-3 and GM-CSF neutralization on endogenous splenic GMP. Data show percent of cells in subG1 and total number of GMP in spleen (means ± SEM, n = 4–5). D. Effect of IL-3 and GM-CSF neutralization on development of myeloid cells after GFP+ GMP pulse chase. Data show GFP+ CD11b+Gr1+ cells in the spleen and blood (means ± SEM, n = 4–5). E. Effect of IL-3 and GM-CSF neutralization on apoptosis and proliferation of endogenous monocytes and neutrophils in the spleen (means ± SEM, n = 4–5). F. Effect of IL-3 and GM-CSF neutralization on the endogenous CD11b+Gr1+ repertoire in the spleen and blood (means ± SEM, n = 4–5). *P< 0.05 compared to wt (A, B) or HCD isotype (C, D, E, F). G. Granulocyte macrophage colony forming units in the spleen. Data show that, in the absence of cytokines, colonies do not form in the spleen, that GM-CSF and IL-3 are sufficient for colony formation, and that a single dose of anti-GM-CSF and anti-IL-3 attenuates colony formation in vitro (means ± SEM, n = 2).
Figure 6
Figure 6
Extramedullary hematopoiesis gives rise to monocytes in response to repeated peritoneal endotoxin challenge. A. Cartoon depicts a pulse-chase experiment in which GFP+ GMPs were adoptively transferred to wild type (wt) C57BL/6 mice that remained naive or were injected with LPS. A representative plot of at least three independent experiments is shown. B. GFP+ GMPs were adoptively transferred to wild type (wt) C57BL/6 mice injected with LPS. Data are representative of at least three independent experiments. C. Enumeration of GFP+ CD11b+Gr1+ cells adoptively transferred as GFP+ GMPs 8 days earlier and retrieved from host spleen and blood of naive or inflammatory mice (means ± SEM, n = 3 to 8). *P< 0.05. D. Intravital microscopy pictograms of the splenic red pulp depict clusters of GFP+ cells adoptively transferred i.v. 8 days earlier into inflammatory (LPS-injected) mice. Vasculature is shown in red and the scale is depicted with white bars. Data are representative of at least three independent experiments. E. Cartoon depicts experimental design for the co-injection of equal numbers of GFP+ GMPs and RFP+ GMPs into C57BL/6 mice injected with LPS. F. Green and red clusters in the subcapsular red pulp 5 days after injection of equal numbers of GFP+ GMPs and RFP+ GMPs. Vasculature is shown in blue and the scale is depicted by a white bar. Data are representative of at least three independent experiments. G. A prototypic departing cell is shown to intravasate and enter the circulation. H. Accumulation of myeloid cells in splenectomized animals. Mice received LPS and were either splenectomized or subjected to sham surgery. Four days later peritoneal CD11b+Gr1+ cells were enumerated. I. Spleen transplantation from CD45.1 donors to CD45.2 recipient mice. Donors were either naive or received LPS. The graph shows the total number of splenic CD11b+Gr1+ that had accumulated in the peritoneum. J. Expression of intracellular TNFα. Histograms show TNFα expression on stimulated cells gated on CD11b+Gr1+ cells of splenic (CD45.1+, red) or other source (i.e., bone marrow) (CD45.2+, blue) origin. Data are representative of at least two independent experiments.
Figure 7
Figure 7
Model depicting the extramedullary generation of monocytes in inflammation. Model shows that mobilized hematopoietic stem and progenitor cells accumulate in the splenic red pulp and give rise to monocytes via IL-3 and GM-CSF. Spleen-derived monocytes infiltrate inflammatory sites and mature to macrophages. The splenic contribution increases as the reservoir enlarges. Monocytes that accumulate from bone marrow directly are omitted in this cartoon.

Similar articles

Cited by

References

    1. Medzhitov R. Origin and physiological roles of inflammation. Nature. 2008;454:428–435. - PubMed
    1. Auffray C, Sieweke MH, Geissmann F. Blood monocytes: development, heterogeneity, and relationship with dendritic cells. Annu Rev Immunol. 2009;27:669–692. - PubMed
    1. Nathan C. Neutrophils and immunity: challenges and opportunities. Nat Rev Immunol. 2006;6:173–182. - PubMed
    1. Geissmann F, Manz MG, Jung S, Sieweke MH, Merad M, Ley K. Development of monocytes, macrophages, and dendritic cells. Science. 2010;327:656–661. - PMC - PubMed
    1. Massberg S, Schaerli P, Knezevic-Maramica I, Kollnberger M, Tubo N, Moseman EA, Huff IV, Junt T, Wagers AJ, Mazo IB, von Andrian UH. Immunosurveillance by hematopoietic progenitor cells trafficking through blood, lymph, and peripheral tissues. Cell. 2007;131:994–1008. - PMC - PubMed

Publication types

Substances