

Inhibiting the palmitoylation/depalmitoylation cycle selectively reduces the growth of hematopoietic cells expressing oncogenic Nras
- PMID: 22144181
- PMCID: PMC3271715
- DOI: 10.1182/blood-2011-06-358960
Inhibiting the palmitoylation/depalmitoylation cycle selectively reduces the growth of hematopoietic cells expressing oncogenic Nras
Abstract
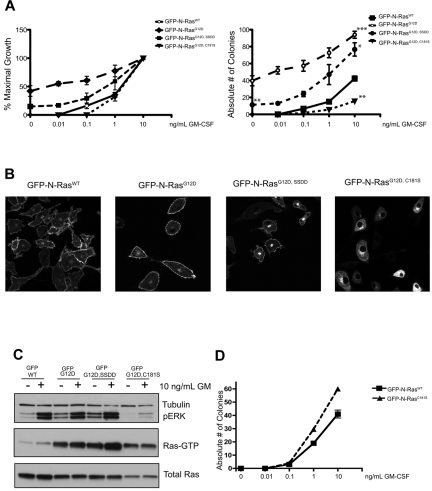
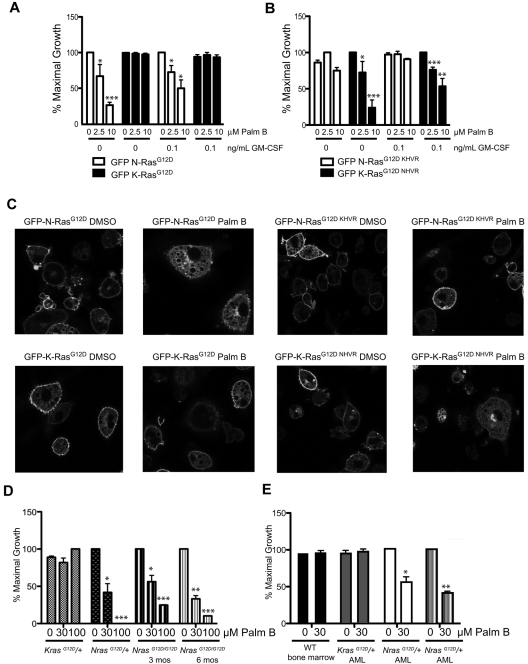
The palmitoylation/depalmitoylation cycle of posttranslational processing is a potential therapeutic target for selectively inhibiting the growth of hematologic cancers with somatic NRAS mutations. To investigate this question at the single-cell level, we constructed murine stem cell virus vectors and assayed the growth of myeloid progenitors. Whereas cells expressing oncogenic N-Ras(G12D) formed cytokine-independent colonies and were hypersensitive to GM-CSF, mutations within the N-Ras hypervariable region induced N-Ras mislocalization and attenuated aberrant progenitor growth. Exposing transduced hematopoietic cells and bone marrow from Nras and Kras mutant mice to the acyl protein thioesterase inhibitor palmostatin B had similar effects on protein localization and colony growth. Importantly, palmostatin B-mediated inhibition was selective for Nras mutant cells, and we mapped this activity to the hypervariable region. These data support the clinical development of depalmitoylation inhibitors as a novel class of rational therapeutics in hematologic malignancies with NRAS mutations.
Figures
Similar articles
-
Genetic disruption of N-RasG12D palmitoylation perturbs hematopoiesis and prevents myeloid transformation in mice.Blood. 2020 May 14;135(20):1772-1782. doi: 10.1182/blood.2019003530. Blood. 2020. PMID: 32219446 Free PMC article.
-
Hematopoiesis and leukemogenesis in mice expressing oncogenic NrasG12D from the endogenous locus.Blood. 2011 Feb 10;117(6):2022-32. doi: 10.1182/blood-2010-04-280750. Epub 2010 Dec 16. Blood. 2011. PMID: 21163920 Free PMC article.
-
Amphiphile-Mediated Depalmitoylation of Proteins in Living Cells.J Am Chem Soc. 2018 Dec 19;140(50):17374-17378. doi: 10.1021/jacs.8b10806. Epub 2018 Dec 10. J Am Chem Soc. 2018. PMID: 30516377
-
Targeting the Ras palmitoylation/depalmitoylation cycle in cancer.Biochem Soc Trans. 2017 Aug 15;45(4):913-921. doi: 10.1042/BST20160303. Epub 2017 Jun 19. Biochem Soc Trans. 2017. PMID: 28630138 Review.
-
Targeting RAS Membrane Association: Back to the Future for Anti-RAS Drug Discovery?Clin Cancer Res. 2015 Apr 15;21(8):1819-27. doi: 10.1158/1078-0432.CCR-14-3214. Clin Cancer Res. 2015. PMID: 25878363 Free PMC article. Review.
Cited by
-
A Novel α/β Hydrolase Domain Protein Derived From Haemonchus contortus Acts at the Parasite-Host Interface.Front Immunol. 2020 Jun 30;11:1388. doi: 10.3389/fimmu.2020.01388. eCollection 2020. Front Immunol. 2020. PMID: 32695121 Free PMC article.
-
Depalmitoylation rewires FLT3-ITD signaling and exacerbates leukemia progression.Blood. 2021 Dec 2;138(22):2244-2255. doi: 10.1182/blood.2021011582. Blood. 2021. PMID: 34111291 Free PMC article.
-
Inhibition of NRAS Signaling in Melanoma through Direct Depalmitoylation Using Amphiphilic Nucleophiles.ACS Chem Biol. 2020 Aug 21;15(8):2079-2086. doi: 10.1021/acschembio.0c00222. Epub 2020 Jul 13. ACS Chem Biol. 2020. PMID: 32568509 Free PMC article.
-
Protein acylation: mechanisms, biological functions and therapeutic targets.Signal Transduct Target Ther. 2022 Dec 29;7(1):396. doi: 10.1038/s41392-022-01245-y. Signal Transduct Target Ther. 2022. PMID: 36577755 Free PMC article. Review.
-
Turning the tide in myelodysplastic/myeloproliferative neoplasms.Nat Rev Cancer. 2017 Jun 23;17(7):425-440. doi: 10.1038/nrc.2017.40. Nat Rev Cancer. 2017. PMID: 28642604 Review.
References
-
- Schubbert S, Shannon K, Bollag G. Hyperactive Ras in developmental disorders and cancer. Nat Rev Cancer. 2007;7(4):295–308. - PubMed
-
- Rocks O, Peyker A, Kahms M, et al. An acylation cycle regulates localization and activity of palmitoylated Ras isoforms. Science. 2005;307(5716):1746–1752. - PubMed
-
- Bos JL. ras oncogenes in human cancer: a review. Cancer Res. 1989;49:4682–4689. - PubMed
-
- Padua RA, Carter G, Hughes D, et al. RAS mutations in myelodysplasia detected by amplification, oligonucleotide hybridization, and transformation. Leukemia. 1988;2(8):503–510. - PubMed
Publication types
MeSH terms
Substances
Grants and funding
LinkOut - more resources
Full Text Sources
Other Literature Sources
Medical
Molecular Biology Databases
Miscellaneous
