. 2011 Dec 4;13(1):58-66.
doi: 10.1038/ni.2182.

Divergent expression patterns of IL-4 and IL-13 define unique functions in allergic immunity

Affiliations

Divergent expression patterns of IL-4 and IL-13 define unique functions in allergic immunity

Hong-Erh Liang et al. Nat Immunol. .

Abstract

Interleukin 4 (IL-4) and IL-13 are critical for responses to parasitic helminthes. We used genetically engineered reporter mice to assess the temporal and spatial production of these cytokines in vivo. In lymph nodes, IL-4, but not IL-13, was made by follicular helper T cells (T(FH) cells). In contrast, tissue type 2 helper T cells (T(H)2 cells) produced both cytokines. There was also divergent production of IL-4 and IL-13 among cells of the innate immune system, whereby basophils produced IL-4, whereas innate helper type 2 cells (Ih2 cells) produced IL-13. IL-13 production by T(H)2 and Ih2 cells was dependent on the transcription factor GATA-3, which was present in large amounts in these cells, and in contrast to the small amount of GATA-3 in T(FH) cells and basophils. The distinct localization and cellular expression of IL-4 and IL-13 explains their unique roles during allergic immunity.


Figures
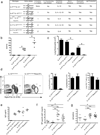
Figure 1
Figure 1. Eosinophil recruitment, worm expulsion and antibody production during N. brasiliensis infection after depletion of IL-13-producing cells
(a) The cell fate, cytokine expression, worm clearance, eosinophil recruitment and IgE production in the indicated reporter mice 9 days post N. brasiliensis infection.[IV1] (b) Total number of worms in the small intestine of N. brasiliensis infected mice, 9 days post infection. (n = 5 mice per group; *P < 0.001, Two-tailed t test). Graph representative of at least 2 independent experiments. (c) Total number of eosinophils (Siglec-Fhi, CD49bneg) in the lung of N. brasiliensis infected mice, 12 days post-infection. (n = 2–3 mice per group; *P < 0.01, Two-tailed t test). Graph representative of at least 3 independent experiments. (d) The percentage and total number of eosinophils (SiglecF/Bchi, DX5neg), basophils (SiglecF/Bcint, DX5high) and CD4+ T cells in the lung of indicated mice on day 9 after N. brasiliensis infection. Plots are representative of two independent experiments (n = 2–4 mice). (e) IgE level in the serum of indicated mice 9 days after N. brasiliensis infection. (n = 5 mice). Graph is representative of at least 3 independent experiments. (f) Expression of high-affinity NP-specific IgG1 in serum of indicated mice 28 days after OVA-NP(15) injection in the footpad (n = 4–15 mice; *P < 0.05, **P < 0.005, Two-tailed t test). Graph is representative of at least 2 independent experiments. (g) Affinity maturation of serum anti-NP-specific IgG1 antibodies from the indicated mice following OVA-NP(15) challenge. Ratio depicts binding of serum IgG1 to BSA-NP(3)/BSA-NP(23) (n = 4–15 mice; *P < 0.05, **P < 0.005, Two-tailed t test). Graph is representative of at least 3 independent experiments. Each data point represents an individual mouse (b, e, f, g) .
Figure 2
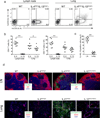
Figure 2. The localization and enumeration of cytokine-producing CD4+ T cells during parasitic infection
(a) The percentage of IL-4- (huCD2) or IL-13 (huCD4)-positive CD4+ T cells in the lung and mediastinal lymph nodes from indicated mice infected 8 days previously with N. brasiliensis. Plots are representative of at least 4 independent experiments (n = 3–5 mice per experiment).(b) Percentage and total number of cytokine-positive CD4+ T cells in the lung and draining mediastinal LN 9 days after N. brasiliensis infection. Graphs represent data points combined from two independent experiments (n = 9; *P < 0.05; **P < 0.0001, two-tailed t test). Each data point represents an individual mouse. (c) Ratio of IL-4/IL-13 producing-CD4+ T cells within the mediastinal lymph nodes and lung 9 days post infection with N. brasiliensis. Graph represents data points combined from two independent experiments (n = 9; **P < 0.0001, two-tailed t test). Data points represent individual mice. (d) Immunohistochemistry of popliteal lymph nodes (Top panel) 21 days after L. major infection and lung (bottom panel) 8 days after N. brasiliensis infection. Wild-type tissues served as negative controls for huCD2 and fluorescent reporter staining. Image magnification is 100x; insets magnification 200x. Images are representative of tissues from 3–4 animals.
Figure 3
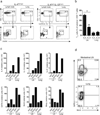
Figure 3. Differential IL-4 and IL-13 production by TFH and canonical TH2 cells
(a) The percentage of IL-4- (huCD2) or IL-13 (huCD4)-producing cells within GFP+ CD4+ T cells in the lymph nodes and lung of IL-4KN2/4get and IL-44get/+IL-13Smart/+ mice 8 days post N. brasiliensis infection. Arrow indicates the percentage of TFH cells among the IL-4- or IL-13-producing cells. Plots are representative of two independent experiments (n = 6 mice). (b) The percentage of (PD-1+ CXCR5+) TFH cells among total IL-4- or IL-13-producing CD4+ T cells in the lymph node or lung from IL-4KN2/4get and IL-44get/+IL-13Smart/+ mice 8 days after N. brasiliensis infection (Percentage of cells ± S.E.M. (n = 4; *P < 0.01, two-tailed t test). Data points combined from two independent experiments. (c) Relative expression of mRNA transcripts plotted against housekeeping gene GAPDH for the indicated genes from CD4+ T cells isolated from the lymph nodes and lungs of IL-4KN2/4get mice 9 days post infection with N. brasiliensis. Data are representative of at least 3 independent experiments. (d) Percentage of intracellular GATA-3 and Bcl-6 in CD4+ T cells isolated from the mediastinal lymph node and lung from IL-4KN2/4get mice 8 days post N. brasiliensis infection. Plots are representative of 5 mice from 2 independent experiments.
Figure 4
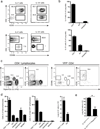
Figure 4. GATA-3 expression in IL-4- and IL-13-producing CD4+ T cells after N. brasiliensis infection
(a) The percentage of intracellular GATA-3high and IL-4- (huCD2) and IL-13 (huCD4)-producing CD4+ T cells from the draining lymph nodes and Lung of WT or IL-4KN2/+IL-13Smart/+ mice 9 days after N. brasiliensis. Plots are representative of at least 5 independent experiments (n = 3–4 mice per experiment). (b) percentage of GATA-3high cells among total IL-4- (huCD2) and IL-13- (huCD4) producing CD4+ T cells in the mediastinal lymph nodes and lung 9 days after N. brasiliensis infection.
Figure 5
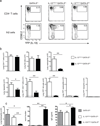
Figure 5. GATA-3 expression and cytokine production by CD4+ T cells in the absence of STAT6
(a) Percentage of GATA-3high CD4+ T cells from wild-type and STAT6-deficient IL-4KN2/+IL-13Smart/+ mice 8 days post N. brasiliensis infection. Data points are combined from two independent experiments. (n = 8; *P < 0.0001, two-tailed t test). Each data point represents an individual mouse. (b) Percentage of GATA-3high IL-4- or IL-13-secreting CD4+ T cells from wild-type and Stat6-deficient IL-4KN2/+IL-13Smart/+ mice 8 days post N. brasiliensis infection. Data points are combined from two independent experiments. (n = 8; *P < 0.0001; **P < 0.0002, two-tailed t test). Each data point represents an individual mouse. (c) Percentage and total number of IL-4- and IL-13-producing CD4+ T cells in the lymph nodes and lung of wild-type and Stat6-deficient IL-4KN2/+IL-13Smart/+ mice 8 days post N. brasiliensis infection. Data points are combined from two independent experiments. (Percentage of cytokine-positive cells or total number ± S.E.M.; n = 8; *P < 0.001; **P < 0.01; ***P < 0.05, two-tailed t test).
Figure 6
Figure 6. IL-4 and IL-13 production by innate type 2 effector cells after N. brasiliensis infection
(a) Top panel shows the percent of ICOS+ CD4+ or ICOS+ CD4 cells among total IL-4- or IL-13-producing lung cells. Bottom panel shows the percentage of CD4+ CD49b or CD4 CD49b+ cells among total IL-4- or IL-13-producing lung cells from IL-4KN2/4get or IL-44get/+IL-13Smart/+ mice 8 days post N. brasiliensis infection. Gates represent CD4+ T cells (CD4+, CD49b, CD278+), Ih2 cells (CD4, CD49b, CD278+), or basophils (CD4, CD49b+, CD278). Plots are representative of at least three independent experiments. (b) Percentage of CD4+ T cells, Ih2 cells, or basophils among total IL-4- and IL-13-producing cells in the lung of IL-4KN2/4get or IL-44get/+IL-13Smart/+ mice 8 days post N. brasiliensis. Graphs are representative of at least 3 independent experiments, percentage of cells ± S.E.M. (n = 3). (c) Percentage of eosinophils (CD4neg,SiglecF/βchi, DX5neg), basophils (CD4neg,SiglecF/βcint, DX5high), and Ih2 cells (CD4neg,SiglecF/βcneg, DX5neg, ICOShigh) among CD4 cells in the lung of IL-13YetCre/YetCre 9 days after N. brasiliensis infection. Plots are representative two independent experiments (n = 9 lungs). (d) The percentage and total number of total and YFP-expressing CD4+ T cells, Ih2 cells, basophils, eosinophils, and NK/NKT cells among total or YFP-positive (IL-13-producing) lymphocytes in the lung of IL-13YetCre/YetCre mice 9 days post N. brasiliensis infection. Graphs are representative of 3 independent experiments, percentage of cells ± S.E.M. (n = 3). (e) The total number of Ih2 cells (SiglecF/Bcneg, DX5neg, CD4neg, ICOShigh) in the lung of IL-13YetCre/YetCre mice 9 days after N. brasiliensis infection. Plots are representative two independent experiments (n = 2–4 lungs).
Figure 7
Figure 7. Requirements for STAT6 and GATA-3 on cytokine production by innate type 2 effector cells
(a) Percentage of intracellular GATA-3high Ih2 (ICOS+) cells and basophils (CD49b+) among total non-T cells in the lung of IL-4KN2/4get and IL-44get/+IL-13Smart/+ mice 9 days post N. brasiliensis infection. Plots are representative of at least three independent experiments (n = 3–4 mice per experiment). (b) Percentage GATA-3high IL-4-(huCD2) and IL-13 (huCD4)-producing CD4+ T cells, Ih2 cells, and basophils from the lungs 8 days after N. brasiliensis infection. (c) Total number of Ih2 cells (ICOS+, CD4, CD8, CD19) in the lung of wild-type and Stat6-deficient IL-4KN2/+IL-13Smart/+ mice. Data points are combined from two independent experiments. (Total Ih2 cells ± S.E.M.; n = 8). (d) The percentage and total number of IL-13 (huCD4)-secreting Ih2 cells in the lungs of wild-type and Stat6-deficient IL-4KN2/+IL-13Smart/+ mice 8 days after N. brasiliensis infection. Data points are combined from two independent experiments. (Total number or percentage of cells ± S.E.M.; n = 8; *P < 0.01, two-tailed t test). (e) Percentage of GATA-3high IL-13-producing Ih2 cells in the mediastinal lymph nodes and lung of wild-type and Stat6-deficient IL-4KN2/+IL-13Smart/+ mice 8 days post N. brasiliensis infection. Data points are combined from two independent experiments. (n = 8; *P < 0.01, two-tailed t test). Each data point represents an individual mouse.
Figure 8
Figure 8. GATA-3 is required for IL-13 expression, innate cell recruitment and worm expulsion, but not IgE production
(a) Percentage of IL-13- (YFP) producing CD4+ T cells and Ih2 cells in the lung of GATA-3fl/+, IL-13YetCre/+GATA-3fl/+, IL-13YetCre/+GATA-3fl/fl mice 9 days post N. brasiliensis infection. Plots are representative of 2 independent experiments with 7–9 mice per group. (b) The number of Total or IL-13-(YFP) producing basophils (CD4neg, Siglec-Fneg, CD49bpos, CD90.2int), eosinophils (CD4neg, Siglec-Fpos, CD49bneg, SSChigh), CD4+ T cells (CD4pos, ICOShigh, CD90.2pos), and Ih2 cells (CD4neg, Siglec-Fneg, CD49bneg, ICOShigh, CD90.2pos) in the lung of IL-13YetCre/+GATA-3fl/+ (white bars) or IL-13YetCre/+GATA-3fl/fl (black bars) of mice 9 days post N. brasiliensis infection. Graphs are a composite of two independent experiments (+/− SEM, n = 7–9 mice per group, *P < 0.05, **P < 0.005, two-tailed t test). Dashed line represents the limit of detection as scored by the reporter negative wild-type control. (c) Eosinophil recruitment, worm expulsion, and total serum IgE assessed in IL-13YetCre/+GATA-3fl/+ (white bars) or IL-13YetCre/+GATA-3fl/fl (black bars) mice 9 days post N. brasiliensis infection. (+/− SEM, n = 4–5 mice per group, *P < 0.05, **P < 0.005, two-tailed t test).

Similar articles

Cited by

References

    1. Brooker S. Estimating the global distribution and disease burden of intestinal nematode infections: adding up the numbers--a review. Int J Parasitol. 40:1137–1144. - PMC - PubMed
    1. Finkelman FD, et al. Interleukin-4- and interleukin-13-mediated host protection against intestinal nematode parasites. Immunol Rev. 2004;201:139–155. - PubMed
    1. Locksley RM. Asthma and allergic inflammation. Cell. 140:777–783. - PMC - PubMed
    1. Fallon PG, et al. Identification of an interleukin (IL)-25-dependent cell population that provides IL-4, IL-5, and IL-13 at the onset of helminth expulsion. J Exp Med. 2006;203:1105–1116. - PMC - PubMed
    1. Fort MM, et al. IL-25 induces IL-4, IL-5, and IL-13 and Th2-associated pathologies in vivo. Immunity. 2001;15:985–995. - PubMed

Publication types

MeSH terms