Dynamic control of protein diffusion within the granal thylakoid lumen
- PMID: 22128333
- PMCID: PMC3250138
- DOI: 10.1073/pnas.1104141109
Dynamic control of protein diffusion within the granal thylakoid lumen
Abstract
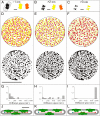
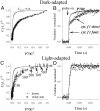
The machinery that conducts the light-driven reactions of oxygenic photosynthesis is hosted within specialized paired membranes called thylakoids. In higher plants, the thylakoids are segregated into two morphological and functional domains called grana and stroma lamellae. A large fraction of the luminal volume of the granal thylakoids is occupied by the oxygen-evolving complex of photosystem II. Electron microscopy data we obtained on dark- and light-adapted Arabidopsis thylakoids indicate that the granal thylakoid lumen significantly expands in the light. Models generated for the organization of the oxygen-evolving complex within the granal lumen predict that the light-induced expansion greatly alleviates restrictions imposed on protein diffusion in this compartment in the dark. Experiments monitoring the redox kinetics of the luminal electron carrier plastocyanin support this prediction. The impact of the increase in protein mobility within the granal luminal compartment in the light on photosynthetic electron transport rates and processes associated with the repair of photodamaged photosystem II complexes is discussed.
Conflict of interest statement
The authors declare no conflict of interest.
Figures


Similar articles
-
Differential mobility of pigment-protein complexes in granal and agranal thylakoid membranes of C₃ and C₄ plants.Plant Physiol. 2013 Jan;161(1):497-507. doi: 10.1104/pp.112.207548. Epub 2012 Nov 12. Plant Physiol. 2013. PMID: 23148078 Free PMC article.
-
Dynamic flexibility in the structure and function of photosystem II in higher plant thylakoid membranes: the grana enigma.Photosynth Res. 2008 Oct-Dec;98(1-3):575-87. doi: 10.1007/s11120-008-9381-3. Epub 2008 Nov 8. Photosynth Res. 2008. PMID: 18998237 Review.
-
Lateral distribution and diffusion of plastocyanin in chloroplast thylakoids.J Cell Biol. 1989 Apr;108(4):1397-405. doi: 10.1083/jcb.108.4.1397. J Cell Biol. 1989. PMID: 2647767 Free PMC article.
-
Lateral heterogeneity of the proton potential along the thylakoid membranes of chloroplasts.Biochim Biophys Acta Biomembr. 2017 Mar;1859(3):388-401. doi: 10.1016/j.bbamem.2016.11.016. Epub 2016 Dec 2. Biochim Biophys Acta Biomembr. 2017. PMID: 27916634
-
Lateral heterogeneity of plant thylakoid protein complexes: early reminiscences.Philos Trans R Soc Lond B Biol Sci. 2012 Dec 19;367(1608):3384-8. doi: 10.1098/rstb.2012.0060. Philos Trans R Soc Lond B Biol Sci. 2012. PMID: 23148264 Free PMC article. Review.
Cited by
-
Regulation of Microalgal Photosynthetic Electron Transfer.Plants (Basel). 2024 Jul 29;13(15):2103. doi: 10.3390/plants13152103. Plants (Basel). 2024. PMID: 39124221 Free PMC article. Review.
-
Specific Composition of Lipid Phases Allows Retaining an Optimal Thylakoid Membrane Fluidity in Plant Response to Low-Temperature Treatment.Front Plant Sci. 2020 Jun 5;11:723. doi: 10.3389/fpls.2020.00723. eCollection 2020. Front Plant Sci. 2020. PMID: 32582253 Free PMC article.
-
A brief history of how microscopic studies led to the elucidation of the 3D architecture and macromolecular organization of higher plant thylakoids.Photosynth Res. 2020 Sep;145(3):237-258. doi: 10.1007/s11120-020-00782-3. Epub 2020 Oct 5. Photosynth Res. 2020. PMID: 33017036 Free PMC article. Review.
-
Characterization of thylakoid division using chloroplast dividing mutants in Arabidopsis.Photosynth Res. 2023 Jul;157(1):1-11. doi: 10.1007/s11120-023-01002-4. Epub 2023 Mar 1. Photosynth Res. 2023. PMID: 36856939
-
Plastid terminal oxidase requires translocation to the grana stacks to act as a sink for electron transport.Proc Natl Acad Sci U S A. 2018 Sep 18;115(38):9634-9639. doi: 10.1073/pnas.1719070115. Epub 2018 Sep 4. Proc Natl Acad Sci U S A. 2018. PMID: 30181278 Free PMC article.
References
-
- Nevo R, Chuartzman SG, Tsabari O, Reich Z. Architecture and plasticity of thylakoid membrane networks. In: Wada H, Murata N, editors. Lipids in Photosynthesis. New York: Springer; 2009. pp. 295–328.
-
- Dekker JP, Boekema EJ. Supramolecular organization of thylakoid membrane proteins in green plants. Biochim Biophys Acta. 2005;1706:12–39. - PubMed
-
- Albertsson PA. A quantitative model of the domain structure of the photosynthetic membrane. Trends Plant Sci. 2001;6:349–358. - PubMed
-
- Anderson JM. Insights into the consequences of grana stacking of thylakoid membranes in vascular plants: A personal perspective. Aust J Plant Physiol. 1999;26:625–639.
Publication types
MeSH terms
Substances
LinkOut - more resources
Full Text Sources
Other Literature Sources

