. 2012 Feb;32(3):652-63.
doi: 10.1128/MCB.06353-11. Epub 2011 Nov 28.

The laforin-malin complex negatively regulates glycogen synthesis by modulating cellular glucose uptake via glucose transporters

Affiliations

The laforin-malin complex negatively regulates glycogen synthesis by modulating cellular glucose uptake via glucose transporters

Pankaj Kumar Singh et al. Mol Cell Biol. 2012 Feb.

Abstract

Lafora disease (LD), an inherited and fatal neurodegenerative disorder, is characterized by increased cellular glycogen content and the formation of abnormally branched glycogen inclusions, called Lafora bodies, in the affected tissues, including neurons. Therefore, laforin phosphatase and malin ubiquitin E3 ligase, the two proteins that are defective in LD, are thought to regulate glycogen synthesis through an unknown mechanism, the defects in which are likely to underlie some of the symptoms of LD. We show here that laforin's subcellular localization is dependent on the cellular glycogen content and that the stability of laforin is determined by the cellular ATP level, the activity of 5'-AMP-activated protein kinase, and the affinity of malin toward laforin. By using cell and animal models, we further show that the laforin-malin complex regulates cellular glucose uptake by modulating the subcellular localization of glucose transporters; loss of malin or laforin resulted in an increased abundance of glucose transporters in the plasma membrane and therefore excessive glucose uptake. Loss of laforin or malin, however, did not affect glycogen catabolism. Thus, the excessive cellular glucose level appears to be the primary trigger for the abnormally higher levels of cellular glycogen seen in LD.


Figures

Fig 1
Fig 1
Subcellular localization of laforin is regulated by the extracellular glucose level. (A) Representative images showing the subcellular localization of GFP-tagged laforin in cells grown in the presence/absence of glucose or serum, as indicated. (B) The percentage of cells showing nuclear localization of laforin (as shown in panel A) when grown in the presence or absence of glucose. (C) Representative images showing subcellular localization GFP-tagged malin in cells grown in the presence/absence of glucose. (D) The cytoplasmic (C) and nuclear (N) fractions of cells grown in the presence (+) or absence (-) of glucose were immunoblotted to show enrichment of GFP-tagged laforin (upper panel) or endogenous laforin (lower panel) in the nuclear compartment. (E) The percentage of cells with nuclear localization of laforin when coexpressed with the indicated RNAi vector. The gel on the right shows RNAi-mediated reduction in the level of malin RNA, as detected by a semiquantitative PCR. Amplification of 7SK RNA served as a control. (F) Cells expressing GFP-tagged laforin were grown in glucose-free medium for 12 h and were then transferred to medium without glucose (bar 1), glucose-free medium with only cycloheximide added (bar 2), or medium with cycloheximide and glucose added (bar 3). The percentage of cells showing nuclear localization was scored at the end of 12 h of incubation. Bars in panels A and C, 10 μm. ***, P < 0.0005.
Fig 2
Fig 2
The intracellular glycogen level regulates laforin's subcellular localization. Nuclear localization of laforin when cells were incubated in medium containing glucose, d-mannitol, l-glucose, or cytochalasin B (CytoB) (A) or with glucose, 3-OMG, 2-DOG, mannoheptulose (manhept), sodium azide (NaN3), or no addition (B) in the presence/absence of glucose is shown. (C) Bar diagram showing ATP levels in cells treated with glucosamine (Glumn), 2-DOG, or sodium azide in the presence/absence of glucose (Glu), as indicated. (D) Representative images showing the subcellular localization of GFP-tagged laforin in cells treated with forskolin (FSK) in the presence of glucose (top panel) or with glucosamine (Glumn) in the absence of glucose (lower panel). Bar, 10 μm. (E) Bar diagram showing the glycogen content in cells transiently expressing GFP-tagged laforin after various treatments as indicated (top panel) or the nuclear localization of laforin (lower panel). (F) Bar diagram showing nuclear localization of laforin (upper panel) or the level of glycosylated protein (immunoblot with anti-O-GlcNAc antibody; lower panel) in cells treated with glucose, glucosamine, or DON. (G) Nuclear localization of laforin (upper panel) or glycogen content (lower panel) in cells treated with glucose or glucose analogues (DOG or OMG). ***, P < 0.0005; **, P < 0.005.
Fig 3
Fig 3
Subcellular localization of laforin mutants. (A) Schematic diagram of the domain organization of laforin and the positions of missense mutations (CBD and dual-specificity phosphatase domain [DSPD]). (B) Representative images of the subcellular localization of laforin mutants in the presence/absence of glucose. Bar, 10 μm. (C) Bar diagram showing nuclear localization of laforin mutants in the presence/absence of glucose. ***, P < 0.0005.
Fig 4
Fig 4
Intracellular glucose availability regulates malin-dependent degradation of laforin. (A and B) Lysates of cells grown in the presence or absence of glucose were immunoblotted with an antibody to detect endogenous laforin, tubulin or GRP75 (A) or transiently expressed laforin (B). (C) Endogenous laforin level in liver tissue lysates (70 μg of protein/lane) from mice that were either fed ad libitum (F) or starved for 24 h (S). (D and E) Cellular levels of the overexpressed laforin (D) or its endogenous form (E) in cells that were grown in the presence/absence of glucose and/or MG132, as indicated. (F and G) Cells coexpressing GFP-tagged laforin with wild-type malin or its mutant C26S (F) or a knockdown construct for malin (G) were evaluated by immunoblotting. (H) Cells expressing the indicated constructs in the presence or absence of glucose were processed for immunoblotting to establish the relative levels of GFP-tagged laforin. (I and J) Cells were exposed to pharmacological agents as indicated, and the cell lysates were processed for immunoblotting to detect the level of transiently expressed GFP-tagged laforin (I) or endogenous laforin (J).
Fig 5
Fig 5
AMPK activity is required for the degradation of laforin under glucose deprivation. (A) Bar diagram showing the fold difference in AMPK activity in cells treated with the indicated compounds. The immunoblot (lower panel) shows AMPK levels in the cell lysates. (B) Cells expressing AMPK-DN and/or GFP-tagged laforin were maintained in medium containing or deprived of glucose and processed for immunoblotting, as indicated. (C) Cells transfected with constructs that code for GFP-tagged laforin and Myc/His-tagged mutant malin (C26S) were processed for a Ni affinity-based pulldown assay. The pulled-down (PD) and whole-cell lysates (WCL) were immunoblotted with the indicated antibodies. (D) Bar diagram showing the effects of DN-AMPKon laforin nuclear localization under glucose deprivation conditions. (E) Bar diagram showing the difference in AMPK activity (upper panel) or the frequency of cells with nuclear localization of laforin (lower panel) when grown in the presence or absence of glucose or compound C, as indicated. **, P < 0.005; *, P < 0.05.
Fig 6
Fig 6
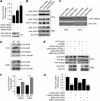
AMPK is necessary but not sufficient to degrade laforin. (A) Cells expressing laforin-GFP, wild-type AMPK (AMPK-WT), or AMPK-DN were treated the indicated compounds and processed for immunoblotting. (B) Cells expressing GFP-tagged laforin were grown in media containing the indicated compounds and processed for immunoblotting. The signal intensities (laforin/tubulin ratio) were measured and plotted as a bar diagram to reveal the fold difference. (C and D) Representative images of the subcellular localization of laforin and wild-type AMPK when coexpressed in COS-7 cells grown in the presence/absence of glucose (C) or the recruitment of overexpressed laforin to the glycogen particle when Neuro2A cells were grown in a medium containing glucose and metformin (Glu+MF) (D). Bar, 10 μm (C and D). (E) Bar diagram showing intracellular glycogen content in COS-7 cells grown in the presence or absence of glucose and/or metformin (MF). (F) Bar diagram (upper panel) showing nuclear localization of laforin in cells treated with metformin or when coexpressed with the wild-type (WT) AMPK or its DN form. The lower panel shows proteasome activity in the lysates of cells under various conditions. Cells treated with MG132 and metformin were transfected with an empty vector. * and ***, P < 0.05 and 0.0005, respectively.
Fig 7
Fig 7
The laforin-malin complex regulates glucose homeostasis. (A) Neuro2A cells were transfected with the indicated RNAi construct, and the difference in the uptake of labeled glucose analogue 2-NBDG was measured and plotted. (B) COS-7 and Neuro2A cells were transiently transfected with the indicated RNAi construct, and the level of endogenous glucose transporter Glut1 (COS-7) or Glut3 (Neuro2A) was evaluated in the whole-cell lysate (WCL) and in the plasma membrane fraction (PMF). The levels of tubulin and transferrin receptor (TFR) served as loading controls. (C) Equal quantities (10 μg/lane) of protein samples representing the WCL and PMF of Neuro2A cells shown in panel B were loaded in the same gel, resolved, and immunoblotted with antibodies for the indicated membrane proteins to reveal the relative enrichment of membrane proteins in the PMF. (D) Immunoblot showing levels of Glut1 and Glut4 proteins in whole-tissue lysate (WTL) and the PMF of soleus skeletal muscle tissue of laforin knockout mice (KO) and their wild-type littermates (WT). Tubulin and caveolin served as loading controls for WTL and PMF, respectively. (E) Neuro2A cells were transfected with a combination of constructs that code for GFP-Glut3 or the WT or the mutants of laforin or malin, and the relative levels of Glut3 in the WCL or in the PMF were evaluated by immunoblotting. (F) Signal intensities (Glut3/transferrin receptor ratio) of the immunoblot for the PMF shown in panel E (lower panel) were measured and plotted to reveal the fold difference. (G) Bar diagram showing glucose uptake in Neuro2A cells transiently expressing the wild-type or the mutant form of laforin or malin as indicated. Values were normalized over protein content and are presented as the fold change compared to pcDNA-transfected cells. *, **, and ***, P < 0.05, 0.005, and 0.0005, respectively.
Fig 8
Fig 8
Laforin and malin regulate glycogen synthesis but not its breakdown. (A) Bar diagram showing glycogen content in COS-7 and Neuro2A cells grown in a medium with 25 mM glucose. (B) Bar diagram showing relative glycogen content in Neuro2A or COS-7 cells transiently transfected with the indicated RNAi construct. The cellular glycogen level was estimated at 36 h posttransfection. (C) Neuro2A cells transfected with the indicated RNAi constructs were scored for the presence of glycogen granules, as visualized with antiglycogen antibody, and plotted. (D) Bar diagram showing glycogen content of COS-7 cells transiently transfected with the indicated RNAi construct and treated/not treated with cytochalasin B (CytoB). (E) Bar diagram showing the fold difference in the glycogen content of COS-7 and Neuro2A cells transiently expressing GFP, glycogen synthase (GS), or Glut3, as indicated. (F) Bar diagram showing the fold change in the glycogen content of COS-7 cells cotransfected with GFP, Glut3, and the RNAi construct. (G) COS-7 cells transiently transfected with the indicated RNAi construct were transferred to glucose-free medium at 36 h posttransfection, and the cellular glycogen content was measured after 12 h of incubation and plotted as the fold change. *, **, and ***, P < 0.05, 0.005, and 0.0005, respectively.

Similar articles

Cited by

References

    1. Becker M, Newman S, Ismail-Beigi F. 1996. Stimulation of GLUT1 glucose transporter expression in response to inhibition of oxidative phosphorylation: role of reduced sulfhydryl groups. Mol. Cell. Endocrinol. 121:165–170 - PubMed
    1. Bell B, Xing H, Yan K, Gautam N, Muslin AJ. 1999. KSR-1 binds to G-protein βγ subunits and inhibits βγ-induced mitogen-activated protein kinase activation. J. Biol. Chem. 274:7982–7986 - PubMed
    1. Boer P, Sperling O. 2004. Modulation of glycogen phosphorylase activity affects 5-phosphoribosyl-1-pyrophosphate availability in rat hepatocyte cultures. Nucleosides Nucleotides Nucleic Acids 23:1235–1239 - PubMed
    1. Carruthers A, DeZutter J, Ganguly A, Devaskar SU. 2009. Will the original glucose transporter isoform please stand up! Am. J. Physiol. 297:E836–E848 - PMC - PubMed
    1. Chan EM, et al. 2004. Laforin preferentially binds the neurotoxic starch-like polyglucosans, which form in its absence in progressive myoclonus epilepsy. Hum. Mol. Genet. 13:1117–1129 - PubMed

Publication types