. 2011 Dec 19;208(13):2717-31.
doi: 10.1084/jem.20111386. Epub 2011 Nov 28.

miR-150 regulates the development of NK and iNKT cells

Affiliations

miR-150 regulates the development of NK and iNKT cells

Natalie A Bezman et al. J Exp Med. .

Abstract

Natural killer (NK) and invariant NK T (iNKT) cells are critical in host defense against pathogens and for the initiation of adaptive immune responses. miRNAs play important roles in NK and iNKT cell development, maturation, and function, but the roles of specific miRNAs are unclear. We show that modulation of miR-150 expression levels has a differential effect on NK and iNKT cell development. Mice with a targeted deletion of miR-150 have an impaired, cell lineage-intrinsic defect in their ability to generate mature NK cells. Conversely, a gain-of-function miR-150 transgene promotes the development of NK cells, which display a more mature phenotype and are more responsive to activation. In contrast, overexpression of miR-150 results in a substantial reduction of iNKT cells in the thymus and in the peripheral lymphoid organs. The transcription factor c-Myb has been shown to be a direct target of miR-150. Our finding of increased NK cell and decreased iNKT cell frequencies in Myb heterozygous bone marrow chimeras suggests that miR-150 differentially controls the development of NK and iNKT cell lineages by targeting c-Myb.


Figures
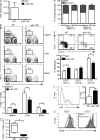
Figure 1.
Figure 1.
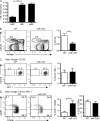
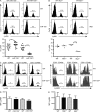
Loss of miR-150 results in reduction and impaired maturation of NK cells. Mixed BM chimeras were generated by injecting WT and miR-150−/− BM cells into irradiated hosts, which were analyzed 8–14 wk later. All stains contained αCD45.1 and αCD45.2 to distinguish between WT (CD45.1+) and miR-150−/− (CD45.2+) populations. Three independent sets of WT:miR-150−/−chimeras were made. (A) RNA was isolated from CD45.1+ NK1.1+ TCRβ and CD45.2+ NK1.1+ TCRβ cells sorted from five chimeras. miR-150 level was quantified by qRT-PCR. Sno202 was used as normalization control. Data are presented as mean ± SEM (n = 3). (B and C) Cells were isolated from the indicated tissues and stained for NK1.1 and TCRβ. (B) The frequencies of NK cells are shown as a percentage of WT and miR-150−/− lymphocytes. Bar graphs represent mean percentages ± SEM of data (n = 11). (C) Absolute numbers of WT and miR-150−/− NK cells ± SEM (n = 6). (D) Contribution of WT and miR-150−/− cells to monocyte (CD11b+ NK1.1) and NK cell (NK1.1+ TCRβ) compartments in peripheral blood of WT:miR-150−/− chimeras. Data are from two independent chimeras experiments (BMQ [1] and BMQ [2]) with nine mice per experiment. (E and F) NK cell maturation was determined by staining splenocytes with NK1.1, TCRβ, CD11b, CD27, and c-Kit antibodies. Gated NK1.1+ TCRβ cells are shown. Bar graph represents mean percentage ± SEM of data (n = 11 [E] and n = 8 [F]). (G) Equal numbers (106) of WT (CD45.1+) and miR-150−/− (CD45.2+) NK cells were labeled with CFSE and adoptively transferred into Rag2−/− x Il2rg−/− mice. At 3 d after transfer, splenocytes were isolated and stained for NK1.1, TCRβ, CD45.2, CD45.1, and CD27. Histograms show CFSE dilution by CD27+ (left) and CD27 (right) WT and miR-150−/− NK cells. (B, C, E, and F) *, P < 0.05; **, P < 0.01. (D) ***, P < 0.001 (paired Student’s t test). Data shown are from two (A, D, and G) and at least five (B, C, E, and F) experiments.
Figure 2.
Figure 2.
Defective IFN-γ production in miR-150−/− NK cells. NK cells from WT:miR-150−/− chimeras were stimulated by either immobilized mAbs (control IgG, αNK1.1, and αLy49H), by incubation with IL-12 and IL-18, or left untreated. Cells were stained for NKp46, TCRβ, CD45.2, and CD45.1 (A) or NKp46, TCRβ, CD45.2, CD45.1, and CD11b (B), and intracellular IFN-γ was determined. (A) Bars represent mean percentages ± SEM of data (n = 6–9). Data shown are from five experiments. *, P < 0.05; **, P < 0.01. (B) Numbers indicate the percentage of CD11b+ or CD11b NK cells staining positive for IFN-γ. Data are representative of two experiments.
Figure 3.
Figure 3.
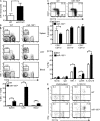
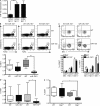
miR-150 promotes development of NK cells in the BM. (A) NKP (lineage [CD4, CD8, CD3, GR1, CD19, and Ter119]-negative, CD122+ NK1.1), iNK (lineage CD122+ NK1.1+ CD51+), and mature NK (mNK; lineage CD122+ NK1.1+ CD51 CD49b+) cells were sorted from the BM of WT mice (n = 3). miR-150 expression was measured using qRT-PCR. Sno202 was used as a normalization control. Mean relative miR-150 level ± SEM is shown. (B–D) BM developmental progression was determined by staining BM cells isolated from WT:miR-150−/− chimeras with CD122, CD4, CD8, CD3, GR1, CD19, Ter119, CD51, CD49b, CD45.1, and CD45.2 antibodies. (B and C) The number of CD122+ (lineage CD122+; B) and NKP (lineage CD122+ NK1.1; C) cells is shown as a percentage of either WT (CD45.1+) or miR-150−/− (CD45.2+) BM cells. Bar graphs represent mean percentages ± SEM of data. n = 9 (B); n = 5 (C). (D) Analysis of CD51 and CD49b expression. Percentages of BM lineage CD122+ NK1.1+ cells positive for each marker among WT (CD45.1+) and miR-150−/− (CD45.2+) cells are shown. Bar graph represents mean percentages ± SEM of data (n = 5). *, P < 0.05; **, P < 0.01. Data are from at least three experiments.
Figure 4.
Figure 4.
Mature hyperfunctional NK cells accumulate in miR-150Tg mice. Mixed BM chimeras were generated by injecting WT and miR-150Tg BM cells into irradiated hosts, which were analyzed 8–14 wk later. All stains contained αCD45.1 and αCD45.2, as in Fig. 1. Two independent sets of WT:miR-150Tg chimeras were made. (A) RNA was isolated from CD45.1+ NK1.1+ TCRβ and CD45.2+ NK1.1+ TCRβ cells sorted from five chimeras. miR-150 level was quantified by qRT-PCR. Sno202 was used as normalization control. Data are presented as mean ± SEM (n = 5). (B) Cells from the indicated tissues were stained for NK1.1 and TCRβ. The numbers are shown as percentage of WT and miR-150Tg lymphocytes. Bar graph represent mean percentages ± SEM of data (n = 13). (C) NK cell maturation was determined by staining splenocytes with NK1.1, TCRβ, CD11b, and CD27 antibodies. Gated NK1.1+ TCRβ cells are shown. Bar graph represents mean percentage ± SEM of data (n = 11). (D) NK cells were stimulated as described in Fig. 2. Cells were stained for NKp46 and TCRβ, and intracellular IFN-γ was determined. Bars represent mean percentages ± SEM of data (n = 6–9). *, P < 0.05; **, P < 0.01; ***, P < 0.001. (E) Numbers indicate the percentage of CD11b+ or CD11b NK cells staining positive for IFN-γ. Data are from two (A and E) and at least five (B–D) experiments.
Figure 5.
Figure 5.
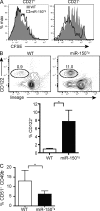
Increased maturation and expansion of miR-150Tg cells in BM and spleen of WT:miR-150Tg chimeras. (A) 107 splenocytes from WT:miR-150Tg chimeras were labeled with CFSE and adoptively transferred into Rag2−/− x Il2rg−/− mice. At 5 d after transfer, splenocytes were isolated and stained for NK1.1, TCRβ, CD45.2, CD45.1, and CD27. Histograms show CFSE dilution by CD27+ (left) and CD27 (right) subsets among WT (CD45.1+) and miR-150Tg (CD45.2+) NK cells. (B and C) The number of CD122+ (lineage CD122+; B) and iNK (lineage CD122+ NK1.1+ CD51+ CD49b; C) cells is shown as a percentage of either WT or miR-150Tg BM cells. Bar graphs represent mean percentages ± SEM of data. n = 9 (B); n = 5 (C). *, P < 0.05. Data are from two (A) and at least five (B and C) experiments.
Figure 6.
Figure 6.
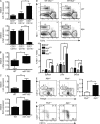
Increased NK cell frequency in Myb+/− mice. (A) miR-150 and c-Myb expression in sorted NK cell subsets (n = 6 for each subset) defined by CD27/CD11b expression. (B and C) Levels of c-Myb, c-kit, and Bcl2 mRNAs in miR-150−/− NK cells. The amount of c-Myb, c-kit, and Bcl2 transcripts in sorted WT and miR-150−/− NK cells were determined by qPCR with normalization to the amount of HPRT in each sample. Data are presented as mean ± SEM (n = 2–6). (D–F) Two sets of mixed BM chimeras were generated by injecting either WT (CD45.1+) and Myb+/+ (CD45.2+) or WT (CD45.1+) and Myb+/− (CD45.2+) BM cells into irradiated hosts. All stains contained αCD45.1 and αCD45.2 to distinguish between WT (CD45.1+) and Myb (CD45.2+) populations. (D) Frequency of Myb+/− NK cells. Splenocytes from WT:Myb+/+ and WT:Myb+/− chimeras were stained for NK1.1 and TCRβ. Gated WT (I and II), Myb+/+ (III), and Myb+/− (IV) cells are shown. Bottom, bar graph represents mean percentage ± SEM of data from WT:Myb+/+ (n = 6) and WT:Myb+/− (n = 7) mice. (E) The number of CD122+ (lineage CD122+) cells is shown as a percentage of either Myb+/+ or Myb+/− BM cells. Bar graphs represent mean percentages ± SEM of data (n = 5). (F) NK cell maturation was determined by staining splenocytes with NK1.1, TCRβ, CD11b, CD27, CD45.2, and CD45.1 antibodies. Gated CD45.2+ NK1.1+ TCRβ cells are shown. *, P < 0.05; **, P < 0.01; ***, P < 0.001. Data are from two (A–C) and at least three (D–F) experiments.
Figure 7.
Figure 7.
Acquisition of the Ly49A NK cell receptor is dependent on the dosage of miR-150 and c-Myb. (A) Splenocytes were isolated from the mixed WT:miR-150−/− and WT:miR-150Tg chimeras described in Figs. 1 and 4, respectively, and stained with NK1.1, TCRβ, CD45.1, CD45.2, and Ly49A antibodies. Histograms show percentages of Ly49A+ cells in WT (CD45.1+) and miR-150 mutant (CD45.2+) NK cells. Cumulative data are shown in a scatter plot. Each symbol represents an individual mouse (n = 14). Horizontal lines represent mean values. (B) Splenocytes were isolated from the mixed WT:Myb+/+ and WT:Myb+/− chimeras described in Fig. 6, and stained as described in A. Histograms show percentage of Ly49A+ cells in WT (CD45.1+) and c-Myb mutant (CD45.2+) NK cells. Each symbol in the scatter plot represents an individual mouse (n = 3). Horizontal lines represent mean values. (C) Percentage of Ly49A+ (left) and Ly49G2+ (right) cells among WT and miR-150Tg NK cell subsets at various stages of maturation in the BM. (D and E) The mean fluorescence intensity (MFI) values of Ly49A staining in miR-150−/−, miR-150Tg and WT Ly49A+ NK cells (D) or between WT, Myb+/+, and Myb+/− Ly49A+ NK cells (E). Data are shown as mean MFI ± SEM. n = 11 (D); n = 3 (E). *, P < 0.05; ***, P < 0.001. Data are from nine (A and D), three (B and E) and two (C) experiments.
Figure 8.
Figure 8.
Partial ablation of c-Myb phenocopies impaired iNKT cell development in miR-150Tg mice. (A) Up-regulation of miR-150 during iNKT cell maturation in the thymus. Developmental intermediates (CD24hi NK1.1, CD24lo NK1.1, and CD24lo NK1.1+) of thymic PBS57-loaded CD1d tetramer (CD1d-tet)+ TCRβ+ iNKT cells were sorted from WT mice. miR-150 expression was measured using qRT-PCR. Sno202 was used as a normalization control. Mean relative miR-150 level ± SEM is shown (n = 3). (B) Percentage of miR-150Tg CD1d-tet+ TCRβ+ cells in thymus of WT:miR-150Tg chimeras. A representative dot-plot analysis of CD1d tetramer and TCRβ staining is shown. Bottom, box plots represent mean percentages ± SEM of data from WT:miR-150−/− (n = 5) and WT:miR-150Tg (n = 7) chimeras. (C) Frequency of CD24hi NK1.1, CD24lo NK1.1, and mature CD24lo NK1.1+ iNKT cells among CD1d-tet+ NK1.1+ TCRβ+ cells from thymus of WT: miR-150−/− and WT:miR-150Tg chimeric mice. Bar graphs depict the mean ± SEM for the proportion of developmental intermediates within miR-150−/− (left) and miR-150Tg (right) CD1d-tet+ iNKT cells. n = 4 for each group. (D and E) Percentage of splenic miR-150Tg and Myb+/− CD1d-tet+ iNKT cells. Bar graphs depict mean ± SEM for the proportion of CD1d-tet+ TCRβ+ iNKT cells in the spleens of WT:miR-150−/− (n = 11), WT:miR-150Tg (n = 11), WT/Myb+/+ (n = 6), and WT/Myb+/− (n = 7) mice. *, P < 0.05; **, P < 0.01; ***, P < 0.001. Data are from two (A and C) and at least three (B, D, and E) experiments.

Similar articles

Cited by

References

    1. Anfossi N., André P., Guia S., Falk C.S., Roetynck S., Stewart C.A., Breso V., Frassati C., Reviron D., Middleton D., et al. 2006. Human NK cell education by inhibitory receptors for MHC class I. Immunity. 25:331–342 10.1016/j.immuni.2006.06.013 - DOI - PubMed
    1. Arase H., Mocarski E.S., Campbell A.E., Hill A.B., Lanier L.L. 2002. Direct recognition of cytomegalovirus by activating and inhibitory NK cell receptors. Science. 296:1323–1326 10.1126/science.1070884 - DOI - PubMed
    1. Bartel D.P. 2004. MicroRNAs: genomics, biogenesis, mechanism, and function. Cell. 116:281–297 10.1016/S0092-8674(04)00045-5 - DOI - PubMed
    1. Barton K., Muthusamy N., Fischer C., Ting C.N., Walunas T.L., Lanier L.L., Leiden J.M. 1998. The Ets-1 transcription factor is required for the development of natural killer cells in mice. Immunity. 9:555–563 10.1016/S1074-7613(00)80638-X - DOI - PubMed
    1. Bender T.P., Kremer C.S., Kraus M., Buch T., Rajewsky K. 2004. Critical functions for c-Myb at three checkpoints during thymocyte development. Nat. Immunol. 5:721–729 10.1038/ni1085 - DOI - PubMed

Publication types

MeSH terms