

Interleukin-10 ablation promotes tumor development, growth, and metastasis
- PMID: 22123924
- PMCID: PMC3261323
- DOI: 10.1158/0008-5472.CAN-10-4627
Interleukin-10 ablation promotes tumor development, growth, and metastasis
Abstract
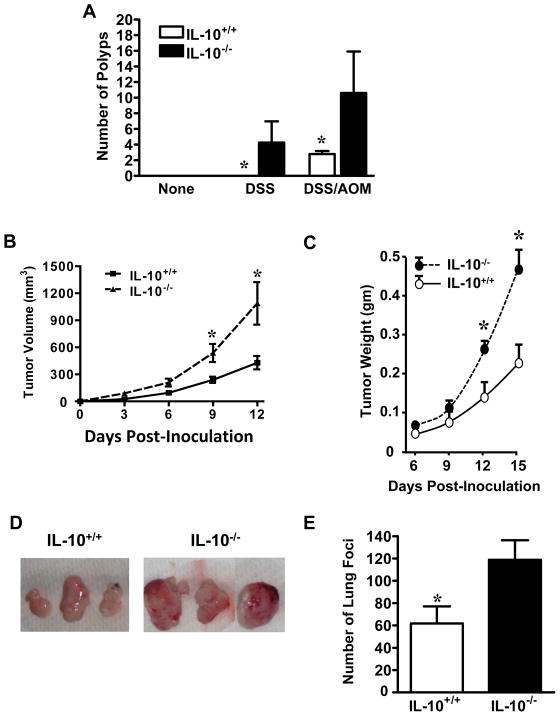
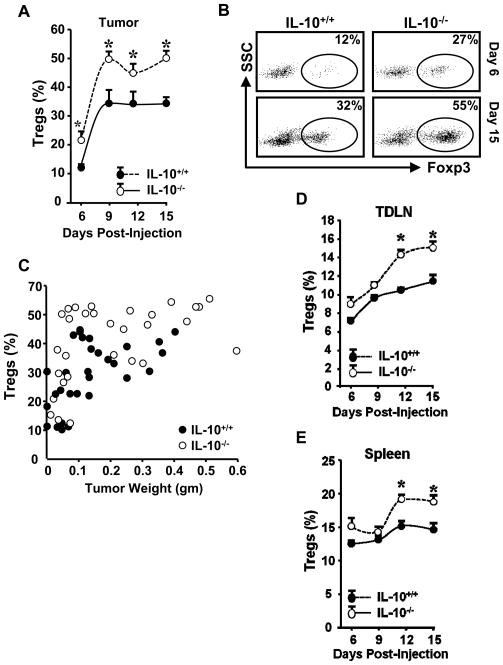
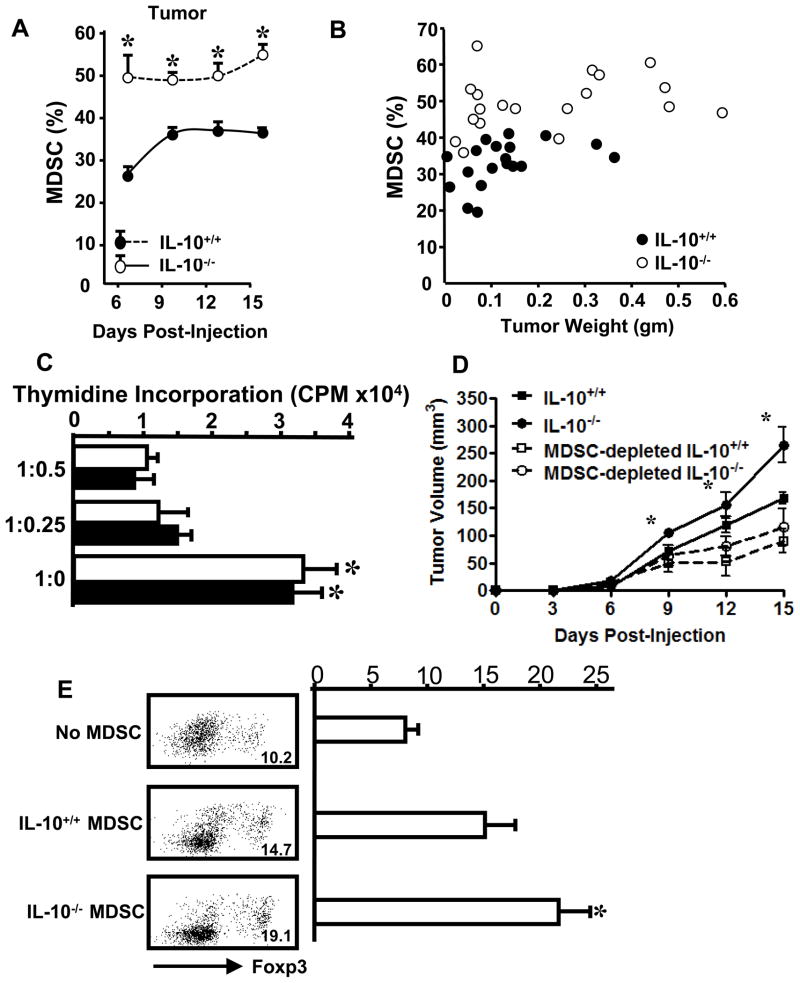
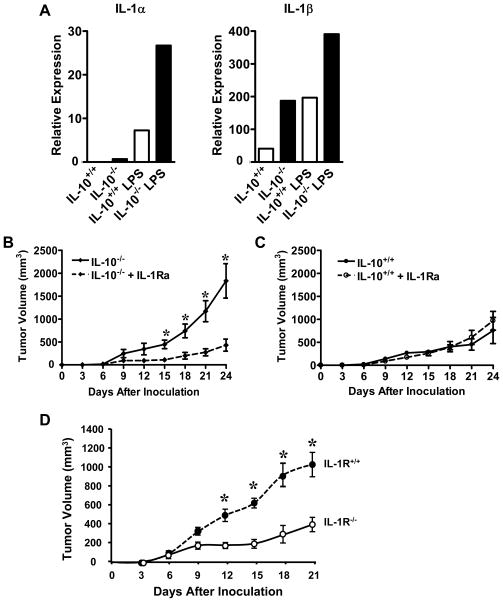
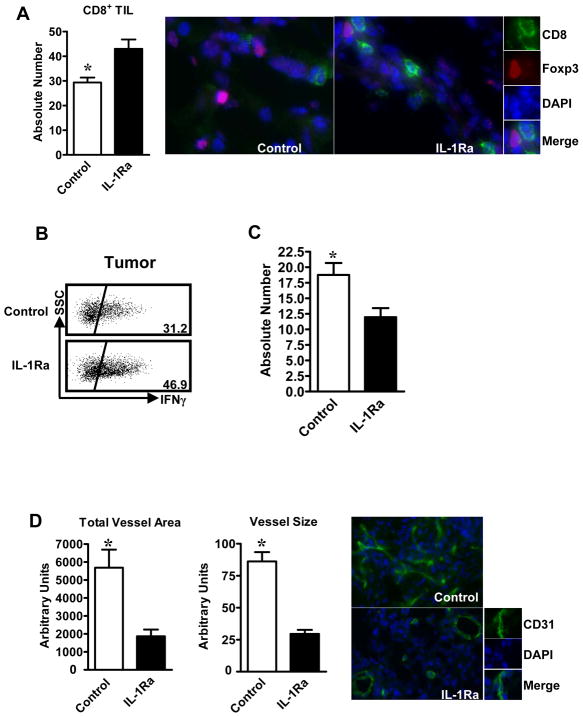
Interleukin-10 (IL-10) is a broadly acting immune inhibitory cytokine that is generally thought to support tumor growth. Here we challenge this view with evidence that genetic ablation of IL-10 in the mouse significantly heightens sensitivity to chemical carcinogenesis, growth of transplanted tumors, and formation of metastases. Tumor growth in IL-10-deficient (IL-10(-/-)) mice was associated with an increased level of myeloid-derived suppressor cells (MDSC) and CD4(+)Foxp3(+) regulatory T (Treg) cells in both the tumor microenvironment and the tumor-draining lymph nodes. IL-10(-/-) MDSCs express high levels of MHC and IL-1, and they efficiently induced formation of Treg cells. IL-1 signaling blockade reduced tumor growth mediated by IL-10 deficiency, associated with a partial rescue of tumor infiltration and function of effector T cells and a decrease in tumor angiogenesis and tumor infiltration by Treg cells. Taken together, our findings establish that endogenous IL-10 inhibits inflammatory cytokine production and hampers the development of Treg cells and MDSCs, two key components of the immunosuppressive tumor microenvironment, thereby inhibiting tumor development, growth, and metastasis.
Conflict of interest statement
Conflict-of-interest disclosure: The authors declare no competing financial interests.
Figures
Similar articles
-
Exogenous interleukin-33 targets myeloid-derived suppressor cells and generates periphery-induced Foxp3⁺ regulatory T cells in skin-transplanted mice.Immunology. 2015 Sep;146(1):81-8. doi: 10.1111/imm.12483. Epub 2015 Jun 19. Immunology. 2015. PMID: 25988395 Free PMC article.
-
Despite increased CD4+Foxp3+ cells within the infection site, BALB/c IL-4 receptor-deficient mice reveal CD4+Foxp3-negative T cells as a source of IL-10 in Leishmania major susceptibility.J Immunol. 2007 Aug 15;179(4):2435-44. doi: 10.4049/jimmunol.179.4.2435. J Immunol. 2007. PMID: 17675505
-
The novel role of tyrosine kinase inhibitor in the reversal of immune suppression and modulation of tumor microenvironment for immune-based cancer therapies.Cancer Res. 2009 Mar 15;69(6):2514-22. doi: 10.1158/0008-5472.CAN-08-4709. Epub 2009 Mar 10. Cancer Res. 2009. PMID: 19276342 Free PMC article.
-
IL-7 inhibits tumor growth by promoting T cell-mediated antitumor immunity in Meth A model.Immunol Lett. 2014 Mar-Apr;158(1-2):159-66. doi: 10.1016/j.imlet.2013.12.019. Epub 2014 Jan 7. Immunol Lett. 2014. PMID: 24406503
-
Targeting Interleukin(IL)-30/IL-27p28 signaling in cancer stem-like cells and host environment synergistically inhibits prostate cancer growth and improves survival.J Immunother Cancer. 2019 Jul 31;7(1):201. doi: 10.1186/s40425-019-0668-z. J Immunother Cancer. 2019. PMID: 31366386 Free PMC article.
Cited by
-
Beyond the Barrier: Unraveling the Mechanisms of Immunotherapy Resistance.Annu Rev Immunol. 2024 Jun;42(1):521-550. doi: 10.1146/annurev-immunol-101819-024752. Epub 2024 Jun 14. Annu Rev Immunol. 2024. PMID: 38382538 Review.
-
Potential clinical application of interleukin-27 as an antitumor agent.Cancer Sci. 2015 Sep;106(9):1103-10. doi: 10.1111/cas.12731. Epub 2015 Aug 6. Cancer Sci. 2015. PMID: 26132605 Free PMC article. Review.
-
Complementing T-cell Function: An Inhibitory Role of the Complement System in T-cell-Mediated Antitumor Immunity.Cancer Discov. 2016 Sep;6(9):953-5. doi: 10.1158/2159-8290.CD-16-0698. Cancer Discov. 2016. PMID: 27587467 Free PMC article.
-
Invited commentary: childhood acute lymphoblastic leukemia and allergies: biology or bias?Am J Epidemiol. 2012 Dec 1;176(11):979-83; discussion 984-5. doi: 10.1093/aje/kws265. Epub 2012 Nov 20. Am J Epidemiol. 2012. PMID: 23171875 Free PMC article.
-
Turn Back the TIMe: Targeting Tumor Infiltrating Myeloid Cells to Revert Cancer Progression.Front Immunol. 2018 Aug 31;9:1977. doi: 10.3389/fimmu.2018.01977. eCollection 2018. Front Immunol. 2018. PMID: 30233579 Free PMC article. Review.
References
-
- Vicari AP, Trinchieri G. Interleukin-10 in viral diseases and cancer: exiting the labyrinth? Immunol Rev. 2004;202:223–36. - PubMed
-
- O’Garra A, Murphy KM. From IL-10 to IL-12: how pathogens and their products stimulate APCs to induce T(H)1 development. Nat Immunol. 2009;10:929–32. - PubMed
-
- Enk AH, Katz SI. Identification and induction of keratinocyte-derived IL-10. J Immunol. 1992;149:92–5. - PubMed
Publication types
MeSH terms
Substances
Grants and funding
LinkOut - more resources
Full Text Sources
Other Literature Sources
Molecular Biology Databases
Research Materials
