. 2011 Nov 27;44(1):40-6.
doi: 10.1038/ng.969.

Regions of focal DNA hypermethylation and long-range hypomethylation in colorectal cancer coincide with nuclear lamina-associated domains

Affiliations

Regions of focal DNA hypermethylation and long-range hypomethylation in colorectal cancer coincide with nuclear lamina-associated domains

Benjamin P Berman et al. Nat Genet. .

Abstract

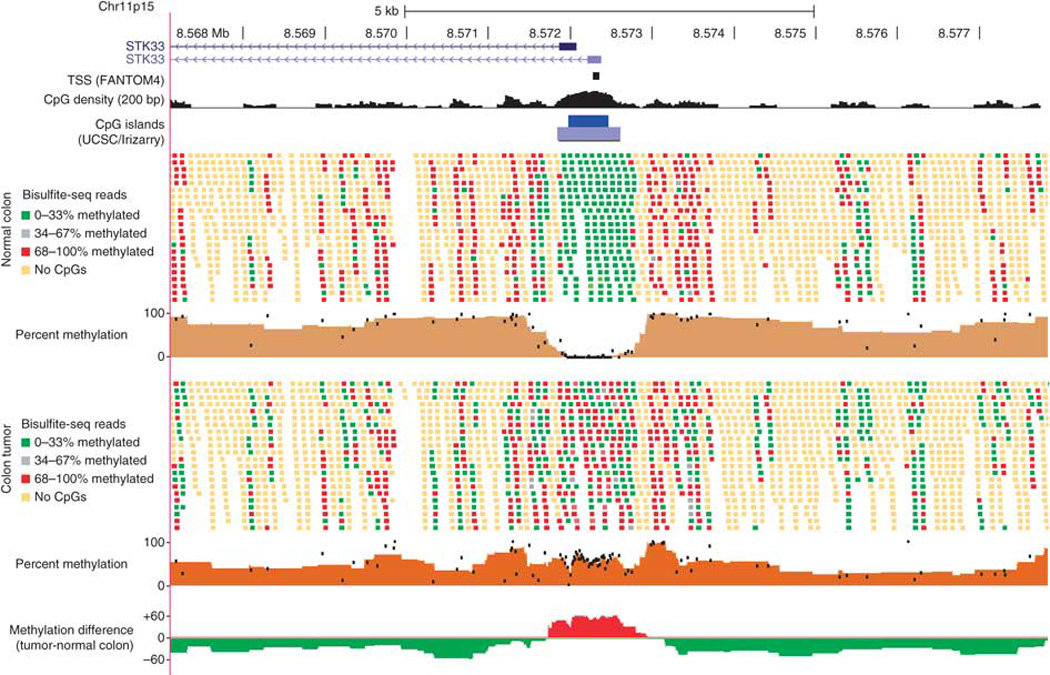
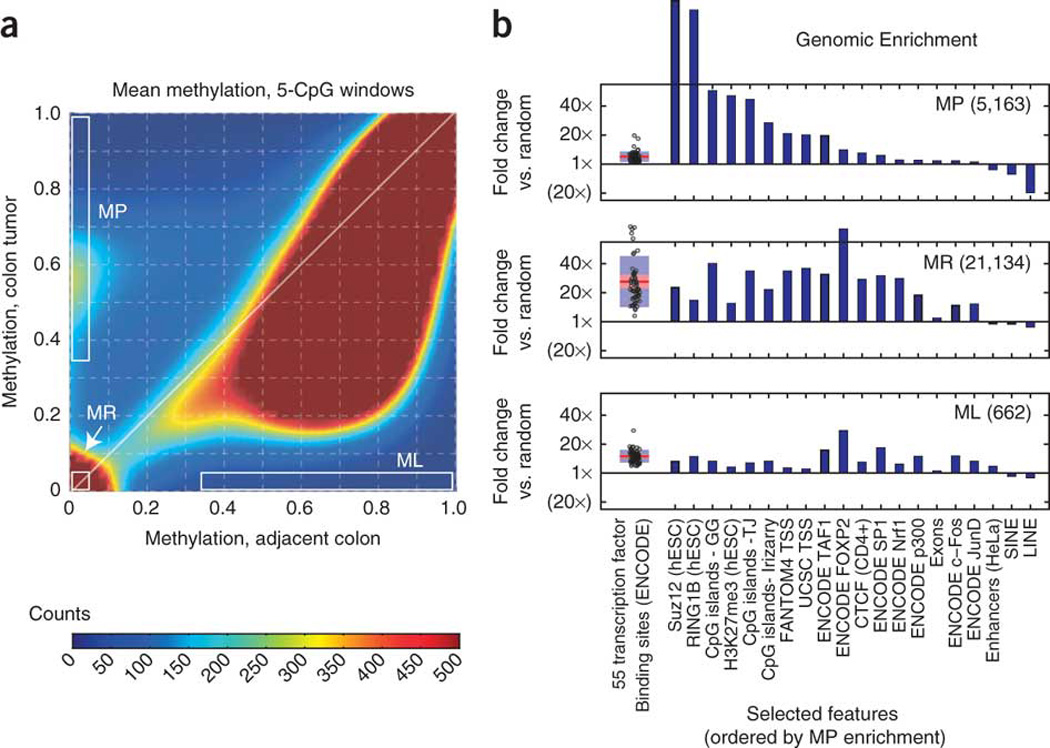
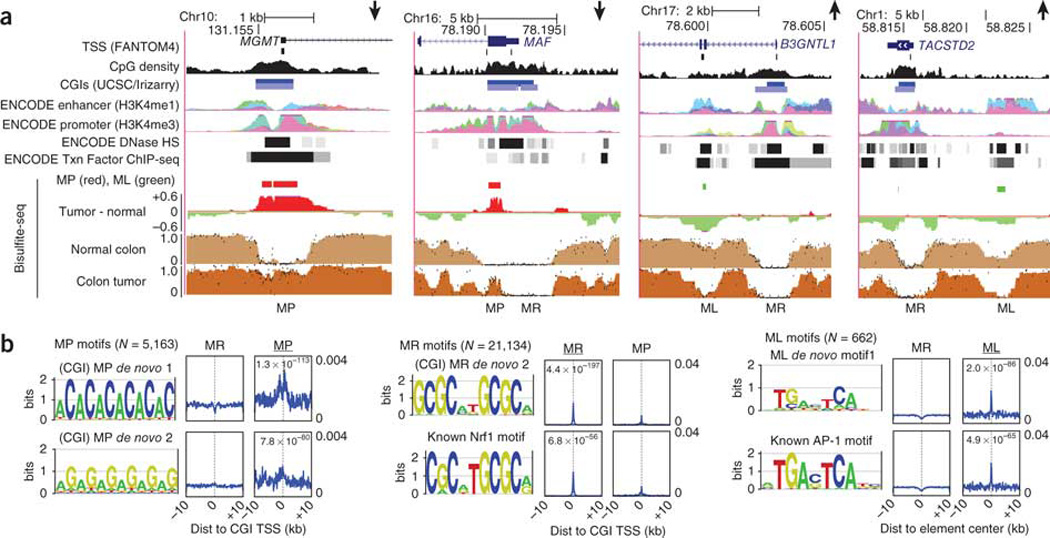
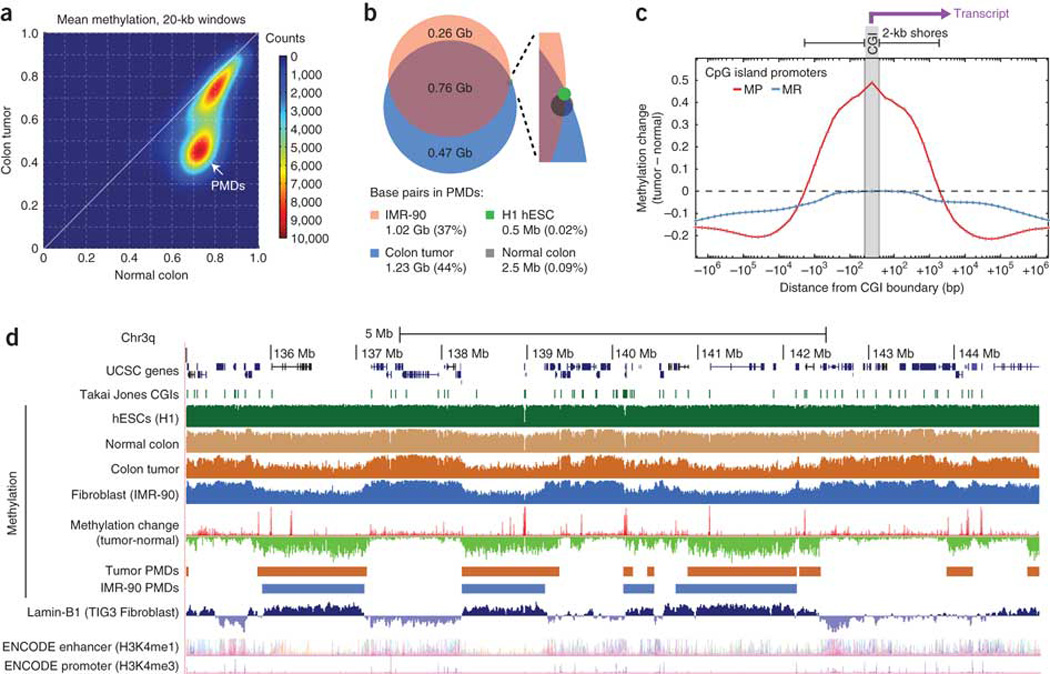
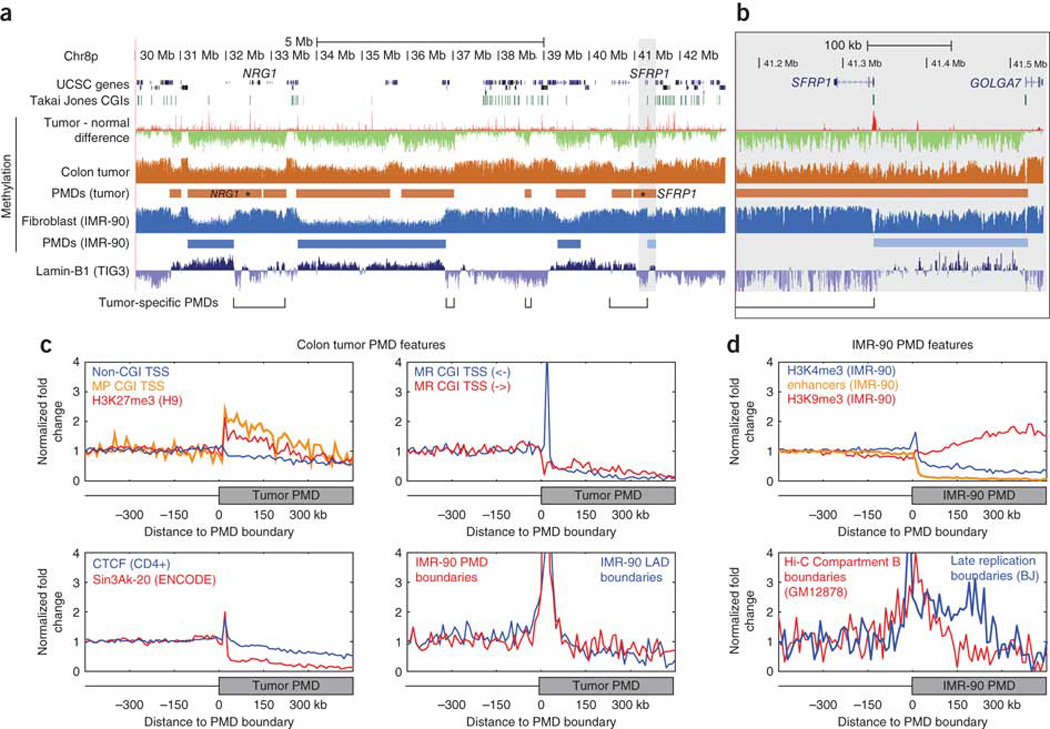
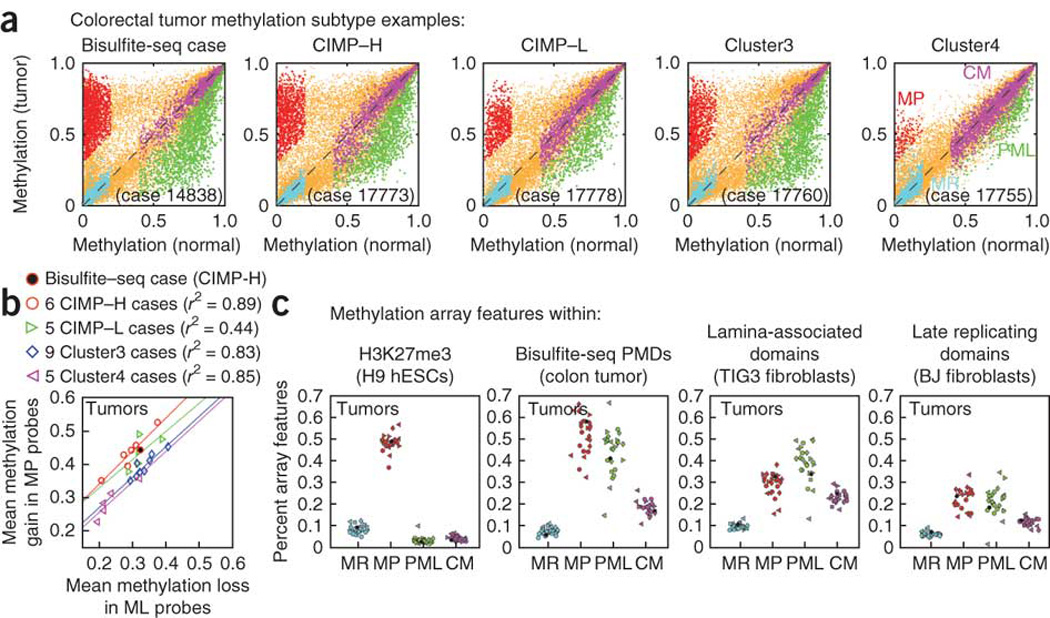
Extensive changes in DNA methylation are common in cancer and may contribute to oncogenesis through transcriptional silencing of tumor-suppressor genes. Genome-scale studies have yielded important insights into these changes but have focused on CpG islands or gene promoters. We used whole-genome bisulfite sequencing (bisulfite-seq) to comprehensively profile a primary human colorectal tumor and adjacent normal colon tissue at single-basepair resolution. Regions of focal hypermethylation in the tumor were located primarily at CpG islands and were concentrated within regions of long-range (>100 kb) hypomethylation. These hypomethylated domains covered nearly half of the genome and coincided with late replication and attachment to the nuclear lamina in human cell lines. We confirmed the confluence of hypermethylation and hypomethylation within these domains in 25 diverse colorectal tumors and matched adjacent tissue. We propose that widespread DNA methylation changes in cancer are linked to silencing programs orchestrated by the three-dimensional organization of chromatin within the nucleus.


Figures

Figure 1
Figure 1. Bisulfite-seq of a colon tumor and adjacent normal mucosa
Individual sequencing reads and summary methylation levels are shown within a 10-kb region around the STK33 gene promoter for the normal adjacent colon tissue (top) and matched colon tumor (bottom). Reads are shown without respect to strand orientation and are colored to indicate the percentage of CpG dinucleotides methylated within the read (reads with no CpGs are indicated in yellow). The percent methylation tracks summarize the percentage of reads methylated for each CpG dinucleotide (black dots) as well as the average methylation within sliding windows of five CpGs (solid brown graph). The methylation difference track at the bottom shows the average methylation difference between tumor and normal tissue within sliding windows of five CpGs, with red indicating tumor hypermethylation and green indicating tumor hypomethylation.
Figure 2
Figure 2. Three distinct methylation classes at focal elements
(a) Density plot of the average DNA methylation within all windows of five adjacent CpG dinucleotides on chromosome 4. Distinct subsets of methylation-prone (MP) and methylation-resistant (MR) windows are visible as high-density clusters, whereas the methylation-loss (ML) region is low density. (b) Comparison of each methylation class to ENCODE protein-DNA binding (ChIP-seq) data and other genomic features (for the full version, see Supplementary Fig. 6). We determined genomic enrichment by dividing the proportion of overlapping elements within each methylation class by the proportion of overlapping elements within size-matched, randomly generated genomic locations (shown as fold changes). All transcription factors are shown in a boxplot (left), and selected genomic features are shown as individual bars (right).
Figure 3
Figure 3. Focal methylation classes correspond to distinct epigenomic and sequence signatures
(a) UCSC Genome Browser plots of two downregulated (MGMT and MAF) and two upregulated (B3GNTL1 and TACSTD2) genes reveal that elements of the methylation-prone (MP), methylation-resistant (MR) and methylation-loss (ML) classes often coincide with a combination of promoter or enhancer histone modifications (H3K4 methylation), DNase I hypersensitivity (HS) and transcription-factor binding. In the enhancer and promoter tracks, each color represents an individual ENCODE cell line, and all cell lines are combined in the DNase HS and transcription factor tracks. (b) Significant results from HOMER sequence motif searches within each of the three methylation classes (for the full results, see the Supplementary Figs. 13–15). Because methylation-prone and methylation-resistant elements most often corresponded to CGI TSS, alignments for these two classes are relative to the oriented TSS, whereas those for the methylation-loss class (right) show alignments relative to the center of the unoriented methylation-loss element. Matches to known motifs from the HOMER database are shown below the de novo motif they match (Nrf1 and AP-1).
Figure 4
Figure 4. Hypermethylated CGIs fall within long, tumor-specific PMDs
(a) Density plot of average DNA methylation within all 20-kb windows on chromosome 4 showing a distinct subset of windows representing PMDs in the tumor but not normal colon tissue. (b) We identified PMDs for four cell types by searching for 100-kb partially methylated windows (see text), and we compared the percentage of the genome contained within PMDs between the tumor and normal colon tissue along with two other cell types. (c) The average methylation change is shown as a function of distance from CGI promoters for all promoters that were unmethylated in the normal colon (with mean methylation <0.2). We divided promoters into methylation-prone (MP; with mean tumor methylation >0.3) and methylation-resistant (MR; with mean tumor methylation <0.2), and the plots are oriented to show the transcribed region toward the right side. (d) UCSC Genome Browser plot of a representative 10-Mb region on chromosome 3q showing substantial overlap between colon tumor and IMR-90 PMDs, Lamin-B1 marks and focal hypermethylation (methylation-resistant elements are visible as red spikes in the methylation change track). Lamin-B1 and ENCODE enhancer and promoter tracks are from the UCSC annotation database.
Figure 5
Figure 5. Properties of PMD boundaries
(a) UCSC Genome Browser plot of a 13-Mb region with several PMD boundaries specific to either the colon tumor or IMR-90 fibroblasts. Tumor-specific PMD regions are annotated, showing that the two epithelial tumor suppressors NRG1 and SFRP1 fall within these regions. (b) A higher resolution view of the highlighted area surrounding SFRP1 showing that the gene promoter is hypermethylated in the tumor and defines a cell-type–specific PMD boundary in IMR-90 cells. (c,d) Average genomic density of a number of annotation features is plotted for 10-kb bins relative to colon tumor (c) and IMR-90 (d) PMD boundaries. Plots are oriented with regions outside the PMD to the left of the midpoint and regions inside the PMD to the right of the midpoint, as shown in the diagrams below each plot. We normalized the genomic density by dividing the value within each bin by the average density within bins lying outside of PMDs. For complete boundary plots, see Supplementary Figure 11.
Figure 6
Figure 6. Tumor-specific hypermethylation and hypomethylation are correlated and are strongly enriched within PMDs in a diverse set of 25 colon tumors
(a) Infinium HumanMethylation27k array values (β values) for five representative tumors, each compared to adjacent normal colon mucosa from the same individual. The tumor sequenced using bisulfite-seq (from individual 14838) is shown alongside one tumor of each methylation subtype from ref. 6, and colored points indicate probes identified as one of four methylation classes: methylation prone (MP, red), methylation resistant (MR, cyan), partial methylation loss (PML, green) and constitutively methylated (CM, purple). Probes not clearly falling into one of these categories are shown in orange. (b) The mean hypermethylation of methylation-prone probes (tumor β minus normal β) and the mean hypomethylation of methylation-loss probes (normal β minus tumor β) show a strong linear correlation (Pearson r = 0.80) across all samples. Colored lines indicate the best robust linear regression fit for each methylation subtype. (c) For each tumor-normal comparison, the fraction of microarray features falling within different genomic regions (H3K27me3, bisulfite-seq PMDs, and so on) is shown, with features separated by methylation class (methylation resistant, methylation prone, methylation loss and constitutively methylated). Shapes indicate tumor subtype as in panel b, with the bisulfite-seq data colored solid black.

Similar articles

Cited by

  • Causes of genome instability: the effect of low dose chemical exposures in modern society.
    Langie SA, Koppen G, Desaulniers D, Al-Mulla F, Al-Temaimi R, Amedei A, Azqueta A, Bisson WH, Brown DG, Brunborg G, Charles AK, Chen T, Colacci A, Darroudi F, Forte S, Gonzalez L, Hamid RA, Knudsen LE, Leyns L, Lopez de Cerain Salsamendi A, Memeo L, Mondello C, Mothersill C, Olsen AK, Pavanello S, Raju J, Rojas E, Roy R, Ryan EP, Ostrosky-Wegman P, Salem HK, Scovassi AI, Singh N, Vaccari M, Van Schooten FJ, Valverde M, Woodrick J, Zhang L, van Larebeke N, Kirsch-Volders M, Collins AR. Langie SA, et al. Carcinogenesis. 2015 Jun;36 Suppl 1(Suppl 1):S61-88. doi: 10.1093/carcin/bgv031. Carcinogenesis. 2015. PMID: 26106144 Free PMC article. Review.
  • Large-Scale Topological Changes Restrain Malignant Progression in Colorectal Cancer.
    Johnstone SE, Reyes A, Qi Y, Adriaens C, Hegazi E, Pelka K, Chen JH, Zou LS, Drier Y, Hecht V, Shoresh N, Selig MK, Lareau CA, Iyer S, Nguyen SC, Joyce EF, Hacohen N, Irizarry RA, Zhang B, Aryee MJ, Bernstein BE. Johnstone SE, et al. Cell. 2020 Sep 17;182(6):1474-1489.e23. doi: 10.1016/j.cell.2020.07.030. Epub 2020 Aug 24. Cell. 2020. PMID: 32841603 Free PMC article.
  • Interplay between the cancer genome and epigenome.
    Shen H, Laird PW. Shen H, et al. Cell. 2013 Mar 28;153(1):38-55. doi: 10.1016/j.cell.2013.03.008. Cell. 2013. PMID: 23540689 Free PMC article. Review.
  • 5-hydroxymethylcytosine marks promoters in colon that resist DNA hypermethylation in cancer.
    Uribe-Lewis S, Stark R, Carroll T, Dunning MJ, Bachman M, Ito Y, Stojic L, Halim S, Vowler SL, Lynch AG, Delatte B, de Bony EJ, Colin L, Defrance M, Krueger F, Silva AL, Ten Hoopen R, Ibrahim AE, Fuks F, Murrell A. Uribe-Lewis S, et al. Genome Biol. 2015 Apr 1;16(1):69. doi: 10.1186/s13059-015-0605-5. Genome Biol. 2015. PMID: 25853800 Free PMC article.
  • The Crossroads of Cancer Epigenetics and Immune Checkpoint Therapy.
    Micevic G, Bosenberg MW, Yan Q. Micevic G, et al. Clin Cancer Res. 2023 Apr 3;29(7):1173-1182. doi: 10.1158/1078-0432.CCR-22-0784. Clin Cancer Res. 2023. PMID: 36449280 Free PMC article. Review.

References

    1. Jones PA, Baylin SB. The fundamental role of epigenetic events in cancer. Nat. Rev. Genet. 2002;3:415–428. - PubMed
    1. Gal-Yam EN, et al. Frequent switching of Polycomb repressive marks and DNA hypermethylation in the PC3 prostate cancer cell line. Proc. Natl. Acad. Sci. USA. 2008;105:12979–12984. - PMC - PubMed
    1. Irizarry RA, et al. The human colon cancer methylome shows similar hypo- and hypermethylation at conserved tissue-specific CpG island shores. Nat. Genet. 2009;41:178–186. - PMC - PubMed
    1. Gebhard C, et al. General transcription factor binding at CpG islands in normal cells correlates with resistance to de novo DNA methylation in cancer cells. Cancer Res. 2010;70:1398–1407. - PubMed
    1. Noushmehr H, et al. Identification of a CpG island methylator phenotype that defines a distinct subgroup of glioma. Cancer Cell. 2010;17:510–522. - PMC - PubMed

Publication types