

Mouse B-type lamins are required for proper organogenesis but not by embryonic stem cells
- PMID: 22116031
- PMCID: PMC3306219
- DOI: 10.1126/science.1211222
Mouse B-type lamins are required for proper organogenesis but not by embryonic stem cells
Abstract
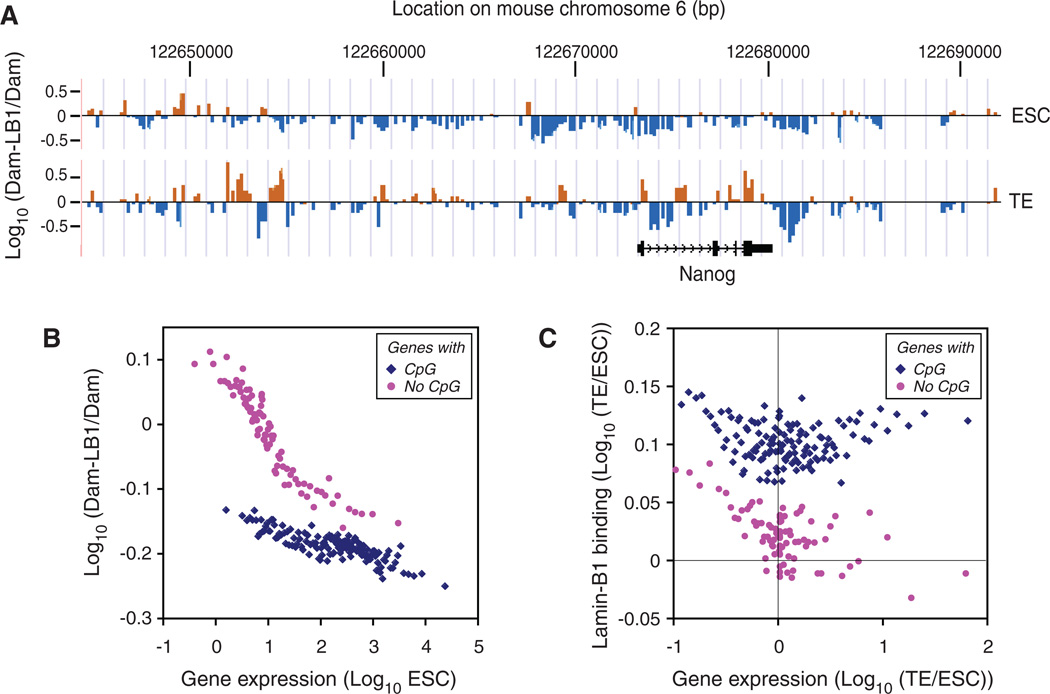
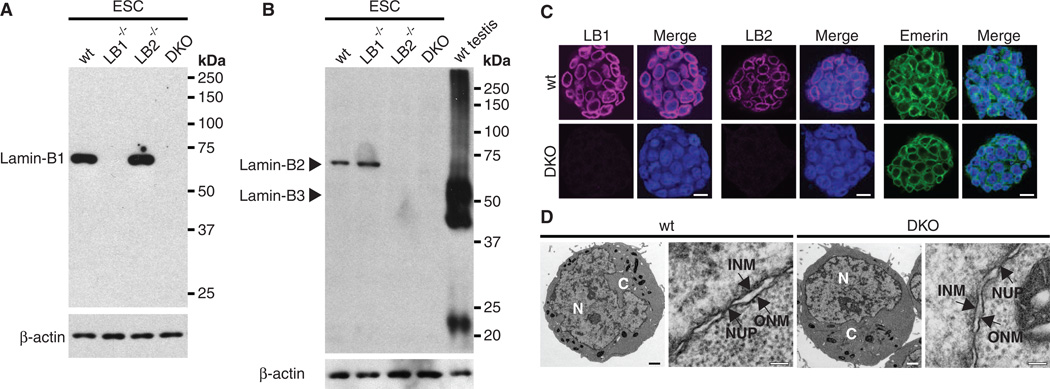
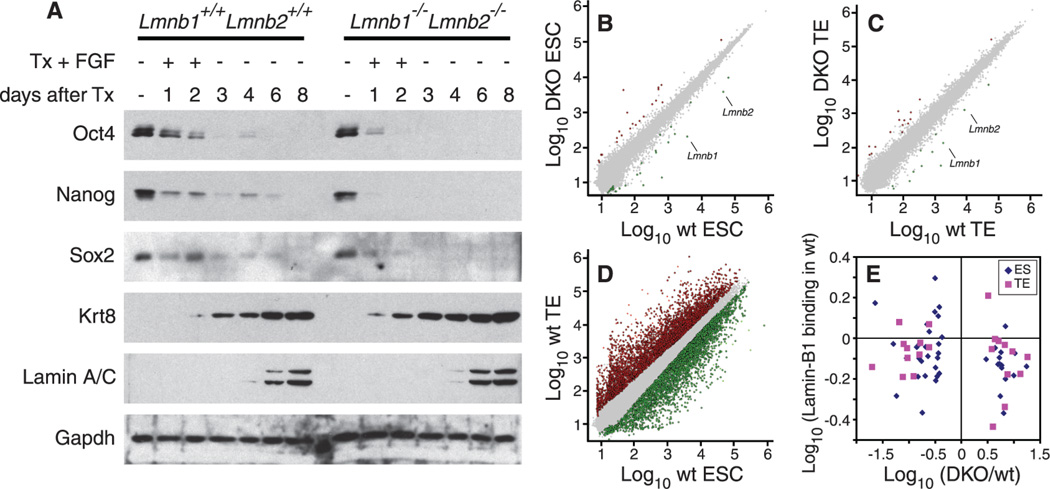
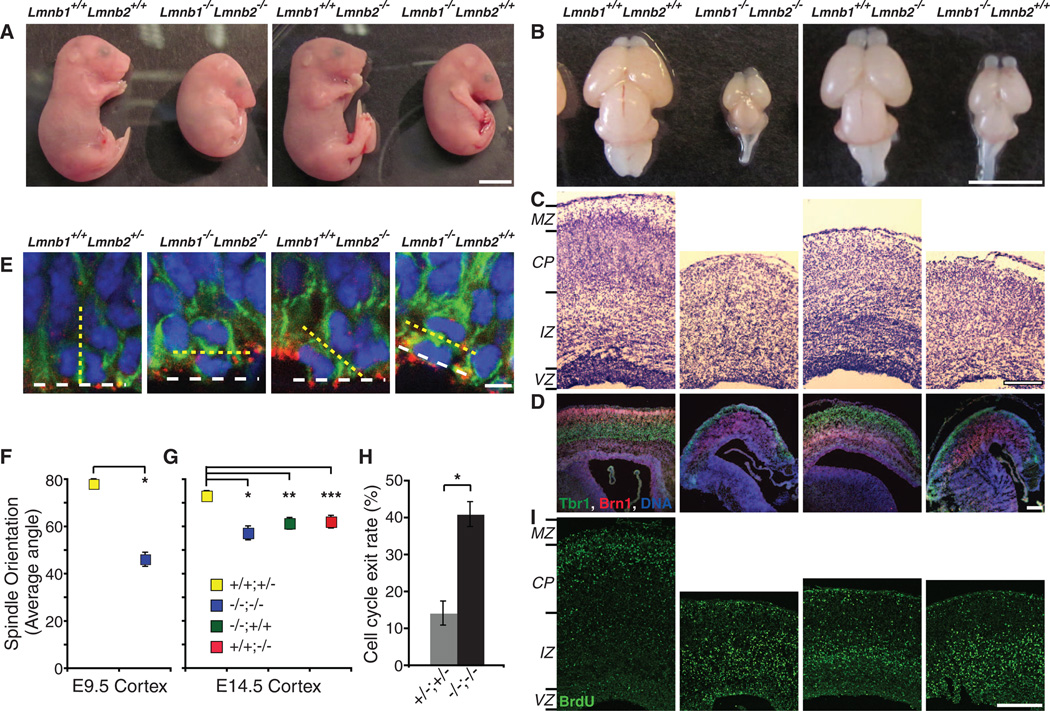
B-type lamins, the major components of the nuclear lamina, are believed to be essential for cell proliferation and survival. We found that mouse embryonic stem cells (ESCs) do not need any lamins for self-renewal and pluripotency. Although genome-wide lamin-B binding profiles correlate with reduced gene expression, such binding is not directly required for gene silencing in ESCs or trophectoderm cells. However, B-type lamins are required for proper organogenesis. Defects in spindle orientation in neural progenitor cells and migration of neurons probably cause brain disorganizations found in lamin-B null mice. Thus, our studies not only disprove several prevailing views of lamin-Bs but also establish a foundation for redefining the function of the nuclear lamina in the context of tissue building and homeostasis.
Figures
Comment in
-
Nucleoskeleton. Uncovering roles for lamin B.Nat Rev Mol Cell Biol. 2011 Dec 14;13(1):3. doi: 10.1038/nrm3257. Nat Rev Mol Cell Biol. 2011. PMID: 22166992 No abstract available.
Similar articles
-
Lamin B1 is required for mouse development and nuclear integrity.Proc Natl Acad Sci U S A. 2004 Jul 13;101(28):10428-33. doi: 10.1073/pnas.0401424101. Epub 2004 Jul 1. Proc Natl Acad Sci U S A. 2004. PMID: 15232008 Free PMC article.
-
Are B-type lamins essential in all mammalian cells?Nucleus. 2011 Nov-Dec;2(6):562-9. doi: 10.4161/nucl.2.6.18085. Epub 2011 Nov 1. Nucleus. 2011. PMID: 22127257 Free PMC article.
-
The function of lamins in the context of tissue building and maintenance.Nucleus. 2012 May-Jun;3(3):256-62. doi: 10.4161/nucl.20392. Epub 2012 May 1. Nucleus. 2012. PMID: 22614537 Free PMC article.
-
B-type lamins in health and disease.Semin Cell Dev Biol. 2014 May;29(100):158-63. doi: 10.1016/j.semcdb.2013.12.012. Epub 2013 Dec 28. Semin Cell Dev Biol. 2014. PMID: 24380701 Free PMC article. Review.
-
The wide and growing range of lamin B-related diseases: from laminopathies to cancer.Cell Mol Life Sci. 2022 Feb 8;79(2):126. doi: 10.1007/s00018-021-04084-2. Cell Mol Life Sci. 2022. PMID: 35132494 Free PMC article. Review.
Cited by
-
Pluripotency in 3D: genome organization in pluripotent cells.Curr Opin Cell Biol. 2012 Dec;24(6):793-801. doi: 10.1016/j.ceb.2012.11.001. Epub 2012 Nov 27. Curr Opin Cell Biol. 2012. PMID: 23199754 Free PMC article. Review.
-
Lamin B1 fluctuations have differential effects on cellular proliferation and senescence.J Cell Biol. 2013 Mar 4;200(5):605-17. doi: 10.1083/jcb.201206121. Epub 2013 Feb 25. J Cell Biol. 2013. PMID: 23439683 Free PMC article.
-
Lamins in development, tissue maintenance and stress.EMBO Rep. 2012 Dec;13(12):1070-8. doi: 10.1038/embor.2012.167. Epub 2012 Nov 13. EMBO Rep. 2012. PMID: 23146893 Free PMC article. Review.
-
The tethering of chromatin to the nuclear envelope supports nuclear mechanics.Nat Commun. 2015 Jun 15;6:7159. doi: 10.1038/ncomms8159. Nat Commun. 2015. PMID: 26074052 Free PMC article.
-
Coaching from the sidelines: the nuclear periphery in genome regulation.Nat Rev Genet. 2019 Jan;20(1):39-50. doi: 10.1038/s41576-018-0063-5. Nat Rev Genet. 2019. PMID: 30356165 Free PMC article. Review.
References
Publication types
MeSH terms
Substances
Grants and funding
LinkOut - more resources
Full Text Sources
Other Literature Sources
Molecular Biology Databases
