T-cell factor 1 is a gatekeeper for T-cell specification in response to Notch signaling
- PMID: 22109558
- PMCID: PMC3250146
- DOI: 10.1073/pnas.1110230108
T-cell factor 1 is a gatekeeper for T-cell specification in response to Notch signaling
Abstract
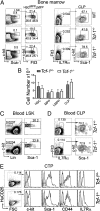
Although transcriptional programs associated with T-cell specification and commitment have been described, the functional hierarchy and the roles of key regulators in structuring/orchestrating these programs remain unclear. Activation of Notch signaling in uncommitted precursors by the thymic stroma initiates the T-cell differentiation program. One regulator first induced in these precursors is the DNA-binding protein T-cell factor 1 (Tcf-1), a T-cell-specific mediator of Wnt signaling. However, the specific contribution of Tcf-1 to early T-cell development and the signals inducing it in these cells remain unclear. Here we assign functional significance to Tcf-1 as a gatekeeper of T-cell fate and show that Tcf-1 is directly activated by Notch signals. Tcf-1 is required at the earliest phase of T-cell determination for progression beyond the early thymic progenitor stage. The global expression profile of Tcf-1-deficient progenitors indicates that basic processes of DNA metabolism are down-regulated in its absence, and the blocked T-cell progenitors become abortive and die by apoptosis. Our data thus add an important functional relationship to the roadmap of T-cell development.
Conflict of interest statement
The authors declare no conflict of interest.
Figures


Similar articles
-
A critical role for TCF-1 in T-lineage specification and differentiation.Nature. 2011 Aug 3;476(7358):63-8. doi: 10.1038/nature10279. Nature. 2011. PMID: 21814277 Free PMC article.
-
Protein Tyrosine Phosphatase PRL2 Mediates Notch and Kit Signals in Early T Cell Progenitors.Stem Cells. 2017 Apr;35(4):1053-1064. doi: 10.1002/stem.2559. Epub 2017 Jan 19. Stem Cells. 2017. PMID: 28009085 Free PMC article.
-
Bone marrow-derived hemopoietic precursors commit to the T cell lineage only after arrival in the thymic microenvironment.J Immunol. 2007 Jan 15;178(2):858-68. doi: 10.4049/jimmunol.178.2.858. J Immunol. 2007. PMID: 17202347
-
Negotiation of the T lineage fate decision by transcription-factor interplay and microenvironmental signals.Immunity. 2007 Jun;26(6):690-702. doi: 10.1016/j.immuni.2007.06.005. Immunity. 2007. PMID: 17582342 Review.
-
Transcriptional drivers of the T-cell lineage program.Curr Opin Immunol. 2012 Apr;24(2):132-8. doi: 10.1016/j.coi.2011.12.012. Epub 2012 Jan 19. Curr Opin Immunol. 2012. PMID: 22264928 Free PMC article. Review.
Cited by
-
Transcriptional network dynamics in early T cell development.J Exp Med. 2024 Oct 7;221(10):e20230893. doi: 10.1084/jem.20230893. Epub 2024 Aug 21. J Exp Med. 2024. PMID: 39167073 Free PMC article. Review.
-
LRP11 promotes stem-like T cells via MAPK13-mediated TCF1 phosphorylation, enhancing anti-PD1 immunotherapy.J Immunother Cancer. 2024 Jan 25;12(1):e008367. doi: 10.1136/jitc-2023-008367. J Immunother Cancer. 2024. PMID: 38272565 Free PMC article.
-
Multimodal profiling reveals site-specific adaptation and tissue residency hallmarks of γδ T cells across organs in mice.Nat Immunol. 2024 Feb;25(2):343-356. doi: 10.1038/s41590-023-01710-y. Epub 2024 Jan 4. Nat Immunol. 2024. PMID: 38177282 Free PMC article.
-
Canonical and noncanonical Wnt signaling: Multilayered mediators, signaling mechanisms and major signaling crosstalk.Genes Dis. 2023 Mar 24;11(1):103-134. doi: 10.1016/j.gendis.2023.01.030. eCollection 2024 Jan. Genes Dis. 2023. PMID: 37588235 Free PMC article. Review.
-
Characterization of TCF-1 and its relationship between CD8+ TIL densities and immune checkpoints and their joint influences on prognoses of lung adenocarcinoma patients.Thorac Cancer. 2023 Sep;14(27):2745-2753. doi: 10.1111/1759-7714.15058. Epub 2023 Aug 3. Thorac Cancer. 2023. PMID: 37536668 Free PMC article.
References
Publication types
MeSH terms
Substances
Associated data
- Actions
Grants and funding
- R01 CA133379/CA/NCI NIH HHS/United States
- R01CA133379/CA/NCI NIH HHS/United States
- R21CA141399/CA/NCI NIH HHS/United States
- R01 CA092433/CA/NCI NIH HHS/United States
- R01 CA149655/CA/NCI NIH HHS/United States
- R01 CA105129/CA/NCI NIH HHS/United States
- F31 AI830542/AI/NIAID NIH HHS/United States
- R01CA149655/CA/NCI NIH HHS/United States
- R01 AI059676/AI/NIAID NIH HHS/United States
- R01CA105129/CA/NCI NIH HHS/United States
- HHMI_/Howard Hughes Medical Institute/United States
- R21 CA141399/CA/NCI NIH HHS/United States
- R01AI059676/AI/NIAID NIH HHS/United States
LinkOut - more resources
Full Text Sources
Other Literature Sources
Molecular Biology Databases

