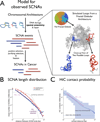
High order chromatin architecture shapes the landscape of chromosomal alterations in cancer
- PMID: 22101486
- PMCID: PMC3268007
- DOI: 10.1038/nbt.2049
High order chromatin architecture shapes the landscape of chromosomal alterations in cancer
Abstract
The accumulation of data on structural variation in cancer genomes provides an opportunity to better understand the mechanisms of genomic alterations and the forces of selection that act upon these alterations in cancer. Here we test evidence supporting the influence of two major forces, spatial chromosome structure and purifying (or negative) selection, on the landscape of somatic copy-number alterations (SCNAs) in cancer. Using a maximum likelihood approach, we compare SCNA maps and three-dimensional genome architecture as determined by genome-wide chromosome conformation capture (HiC) and described by the proposed fractal-globule model. This analysis suggests that the distribution of chromosomal alterations in cancer is spatially related to three-dimensional genomic architecture and that purifying selection, as well as positive selection, influences SCNAs during somatic evolution of cancer cells.
Figures


Comment in
-
Genomic instability: close-up on cancer copy number alterations.Nat Rev Genet. 2011 Nov 29;13(1):5. doi: 10.1038/nrg3133. Nat Rev Genet. 2011. PMID: 22124481 No abstract available.
-
Genomic rearrangement in three dimensions.Nat Biotechnol. 2011 Dec 8;29(12):1096-8. doi: 10.1038/nbt.2064. Nat Biotechnol. 2011. PMID: 22158363 No abstract available.
Similar articles
-
Genomic instability: close-up on cancer copy number alterations.Nat Rev Genet. 2011 Nov 29;13(1):5. doi: 10.1038/nrg3133. Nat Rev Genet. 2011. PMID: 22124481 No abstract available.
-
Genomic rearrangement in three dimensions.Nat Biotechnol. 2011 Dec 8;29(12):1096-8. doi: 10.1038/nbt.2064. Nat Biotechnol. 2011. PMID: 22158363 No abstract available.
-
Genetically predicted telomere length is associated with clonal somatic copy number alterations in peripheral leukocytes.PLoS Genet. 2020 Oct 22;16(10):e1009078. doi: 10.1371/journal.pgen.1009078. eCollection 2020 Oct. PLoS Genet. 2020. PMID: 33090998 Free PMC article.
-
Modelling chromosome structural and copy number changes to understand cancer genomes.Curr Opin Genet Dev. 2019 Feb;54:25-32. doi: 10.1016/j.gde.2019.02.005. Epub 2019 Mar 25. Curr Opin Genet Dev. 2019. PMID: 30921673 Review.
-
Novel insights into chromosomal conformations in cancer.Mol Cancer. 2017 Nov 17;16(1):173. doi: 10.1186/s12943-017-0741-5. Mol Cancer. 2017. PMID: 29149895 Free PMC article. Review.
Cited by
-
An independent genome duplication inferred from Hox paralogs in the American paddlefish--a representative basal ray-finned fish and important comparative reference.Genome Biol Evol. 2012;4(9):937-53. doi: 10.1093/gbe/evs067. Epub 2012 Jul 31. Genome Biol Evol. 2012. PMID: 22851613 Free PMC article.
-
Molecular characteristics and chromatin texture features in acute promyelocytic leukemia.Diagn Pathol. 2012 Jun 28;7:75. doi: 10.1186/1746-1596-7-75. Diagn Pathol. 2012. PMID: 22742960 Free PMC article.
-
Advances in biophotonics detection of field carcinogenesis for colon cancer risk stratification.J Cancer. 2013;4(3):251-61. doi: 10.7150/jca.5838. Epub 2013 Mar 15. J Cancer. 2013. PMID: 23459690 Free PMC article.
-
Nuclear Actin Dynamics in Gene Expression, DNA Repair, and Cancer.Results Probl Cell Differ. 2022;70:625-663. doi: 10.1007/978-3-031-06573-6_23. Results Probl Cell Differ. 2022. PMID: 36348125 Free PMC article.
-
Functional genomics lead to new therapies in follicular lymphoma.Ann N Y Acad Sci. 2013 Jul;1293:18-24. doi: 10.1111/nyas.12120. Epub 2013 May 15. Ann N Y Acad Sci. 2013. PMID: 23676193 Free PMC article. Review.
References
-
- Wood LD, et al. The genomic landscapes of human breast and colorectal cancers. Science. 2007;318:1108–1113. - PubMed
Publication types
MeSH terms
Substances
Grants and funding
LinkOut - more resources
Full Text Sources

