

Brassinosteroids modulate the efficiency of plant immune responses to microbe-associated molecular patterns
- PMID: 22087001
- PMCID: PMC3252953
- DOI: 10.1073/pnas.1112840108
Brassinosteroids modulate the efficiency of plant immune responses to microbe-associated molecular patterns
Abstract
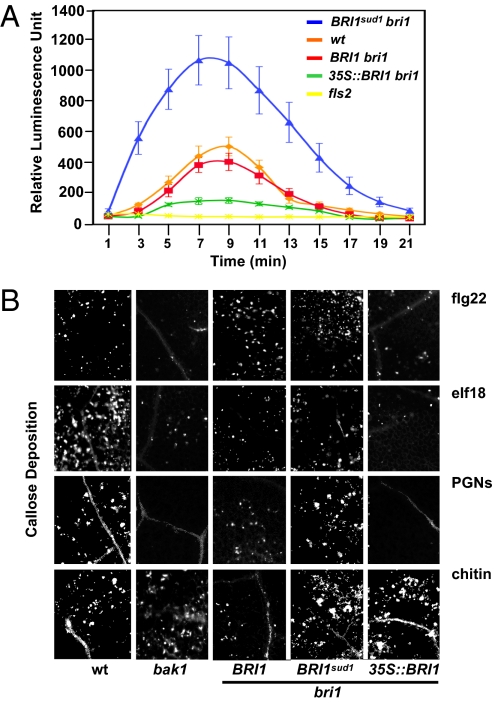
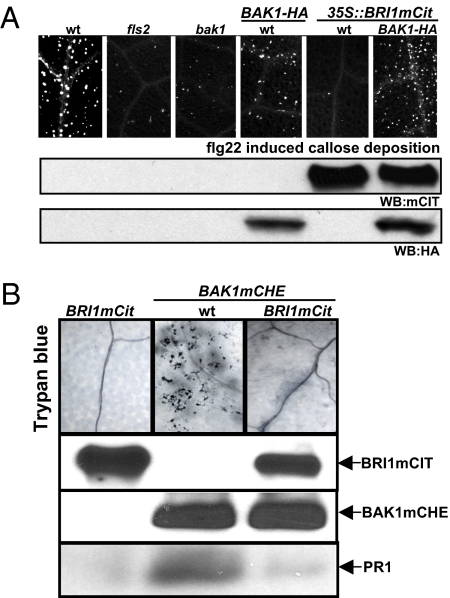
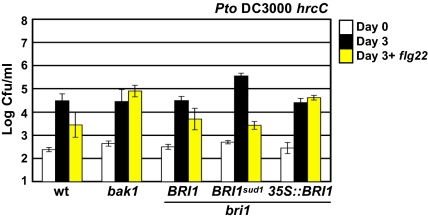
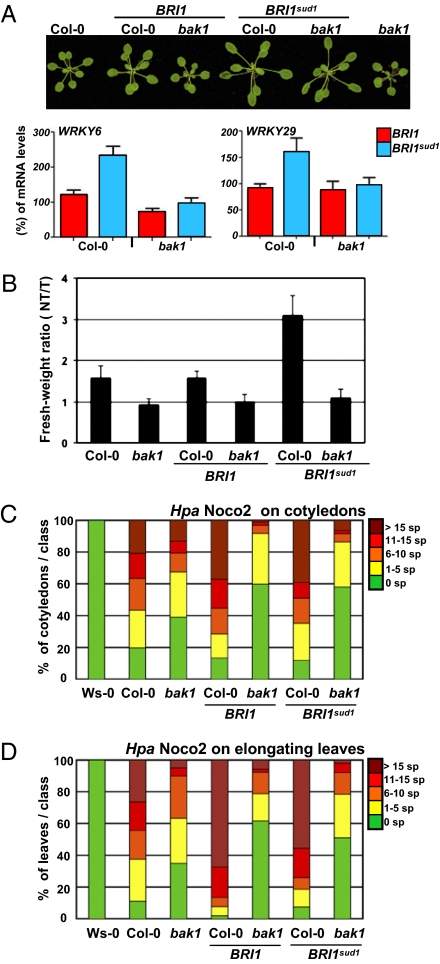
Metazoans and plants use pattern recognition receptors (PRRs) to sense conserved microbial-associated molecular patterns (MAMPs) in the extracellular environment. In plants, the bacterial MAMPs flagellin and elongation factor Tu (EF-Tu) activate distinct, phylogenetically related cell surface pattern recognition receptors of the leucine-rich repeat receptor kinase (LRR-RK) family called FLS2 and EF-Tu receptor, respectively. BAK1 is an LRR-RK coreceptor for both FLS2 and EF-Tu receptor. BAK1 is also a coreceptor for the plant brassinosteroid (BR) receptor, the LRR-RK BRI1. Binding of BR to BRI1 primarily promotes cell elongation. Here, we tune the BR pathway response to establish how plant cells can generate functionally different cellular outputs in response to MAMPs and pathogens. We demonstrate that BR can act antagonistically or synergistically with responses to MAMPs. We further show that the synergistic activities of BRs on MAMP responses require BAK1. Our results highlight the importance of plant steroid homeostasis as a critical step in the establishment of plant immunity. We propose that tradeoffs associated with plasticity in the face of infection are layered atop plant steroid developmental programs.
Conflict of interest statement
The authors declare no conflict of interest.
Figures

Comment in
-
Brassinosteroids modulate plant immunity at multiple levels.Proc Natl Acad Sci U S A. 2012 Jan 3;109(1):7-8. doi: 10.1073/pnas.1118600109. Epub 2011 Dec 22. Proc Natl Acad Sci U S A. 2012. PMID: 22198764 Free PMC article. No abstract available.
Similar articles
-
Brassinosteroids inhibit pathogen-associated molecular pattern-triggered immune signaling independent of the receptor kinase BAK1.Proc Natl Acad Sci U S A. 2012 Jan 3;109(1):303-8. doi: 10.1073/pnas.1109921108. Epub 2011 Nov 15. Proc Natl Acad Sci U S A. 2012. PMID: 22087006 Free PMC article.
-
A flagellin-induced complex of the receptor FLS2 and BAK1 initiates plant defence.Nature. 2007 Jul 26;448(7152):497-500. doi: 10.1038/nature05999. Epub 2007 Jul 11. Nature. 2007. PMID: 17625569
-
Brassinosteroids modulate plant immunity at multiple levels.Proc Natl Acad Sci U S A. 2012 Jan 3;109(1):7-8. doi: 10.1073/pnas.1118600109. Epub 2011 Dec 22. Proc Natl Acad Sci U S A. 2012. PMID: 22198764 Free PMC article. No abstract available.
-
A renaissance of elicitors: perception of microbe-associated molecular patterns and danger signals by pattern-recognition receptors.Annu Rev Plant Biol. 2009;60:379-406. doi: 10.1146/annurev.arplant.57.032905.105346. Annu Rev Plant Biol. 2009. PMID: 19400727 Review.
-
A look at plant immunity through the window of the multitasking coreceptor BAK1.Curr Opin Plant Biol. 2017 Aug;38:10-18. doi: 10.1016/j.pbi.2017.04.007. Epub 2017 Apr 28. Curr Opin Plant Biol. 2017. PMID: 28458047 Review.
Cited by
-
Brassinosteroid signalling.Development. 2013 Apr;140(8):1615-20. doi: 10.1242/dev.060590. Development. 2013. PMID: 23533170 Free PMC article. Review.
-
Regulation of pattern recognition receptor signalling in plants.Nat Rev Immunol. 2016 Sep;16(9):537-52. doi: 10.1038/nri.2016.77. Epub 2016 Aug 1. Nat Rev Immunol. 2016. PMID: 27477127 Review.
-
Deubiquitinating enzymes UBP12 and UBP13 stabilize the brassinosteroid receptor BRI1.EMBO Rep. 2022 Apr 5;23(4):e53354. doi: 10.15252/embr.202153354. Epub 2022 Feb 15. EMBO Rep. 2022. PMID: 35166439 Free PMC article.
-
Brassinosteroid-mediated regulation of agronomic traits in rice.Plant Cell Rep. 2014 May;33(5):683-96. doi: 10.1007/s00299-014-1578-7. Epub 2014 Mar 26. Plant Cell Rep. 2014. PMID: 24667992 Free PMC article. Review.
-
Physiological Responses to the Foliar Application of Synthetic Resistance Elicitors in Cape Gooseberry Seedlings Infected with Fusarium oxysporum f. sp. physali.Plants (Basel). 2020 Feb 1;9(2):176. doi: 10.3390/plants9020176. Plants (Basel). 2020. PMID: 32024161 Free PMC article.
References
-
- Jones JD, Dangl JL. The plant immune system. Nature. 2006;444:323–329. - PubMed
-
- Pieterse CM, Leon-Reyes A, Van der Ent S, Van Wees SC. Networking by small-molecule hormones in plant immunity. Nat Chem Biol. 2009;5:308–316. - PubMed
-
- Ronald PC, Beutler B. Plant and animal sensors of conserved microbial signatures. Science. 2010;330:1061–1064. - PubMed
-
- Spoel SH, Dong X. Making sense of hormone crosstalk during plant immune responses. Cell Host Microbe. 2008;3:348–351. - PubMed
-
- Vert G. Plant signaling: Brassinosteroids, immunity and effectors are BAK. Curr Biol. 2008;18:R963–R965. - PubMed
Publication types
MeSH terms
Substances
Grants and funding
LinkOut - more resources
Full Text Sources
Other Literature Sources
Molecular Biology Databases
