. 2012 Jan 2;287(1):660-671.
doi: 10.1074/jbc.M111.298919. Epub 2011 Nov 15.

Angiotensin II increases activity of the epithelial Na+ channel (ENaC) in distal nephron additively to aldosterone

Affiliations

Angiotensin II increases activity of the epithelial Na+ channel (ENaC) in distal nephron additively to aldosterone

Mykola Mamenko et al. J Biol Chem. .

Abstract

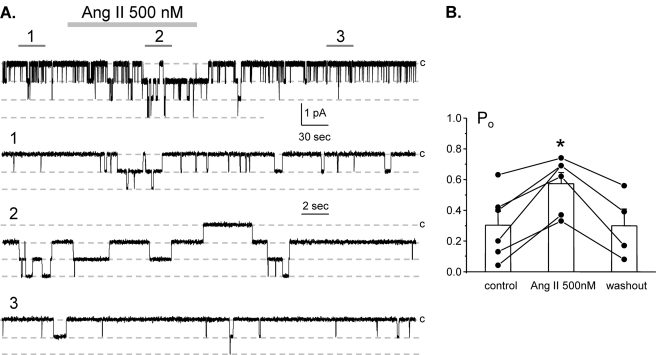
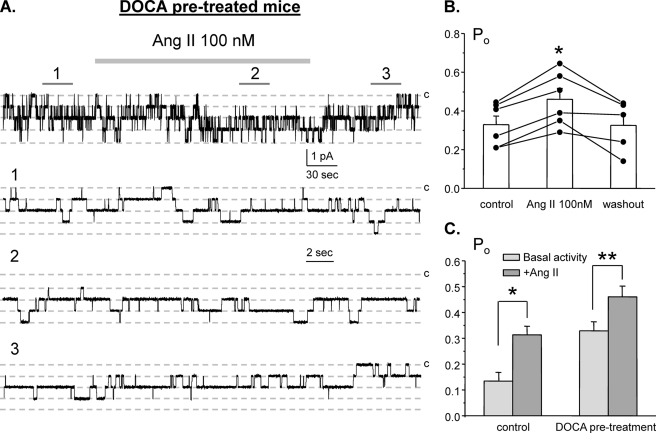
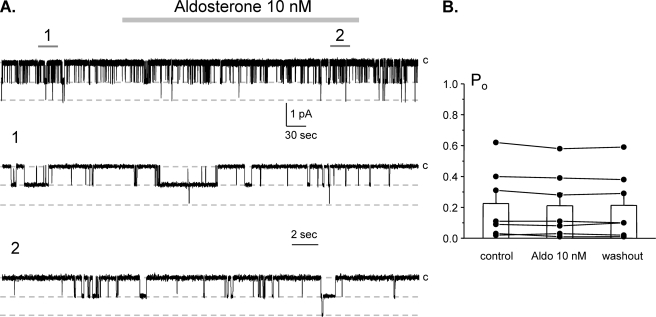
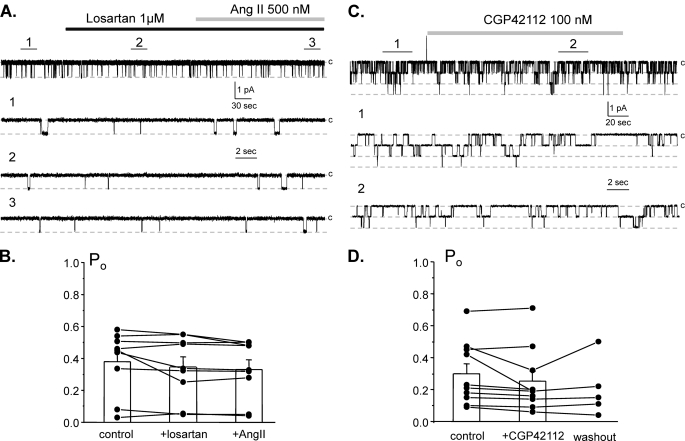
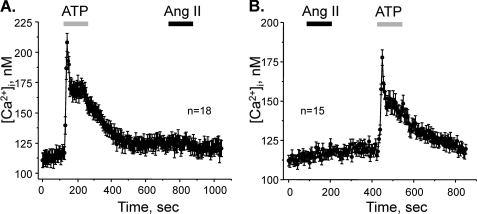
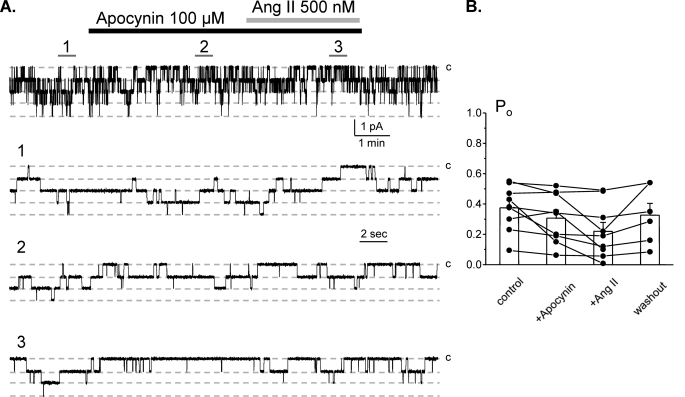
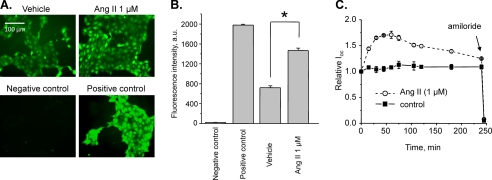
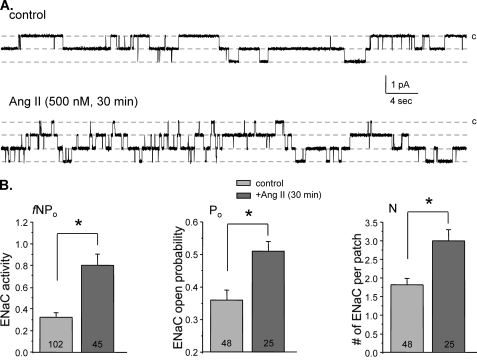
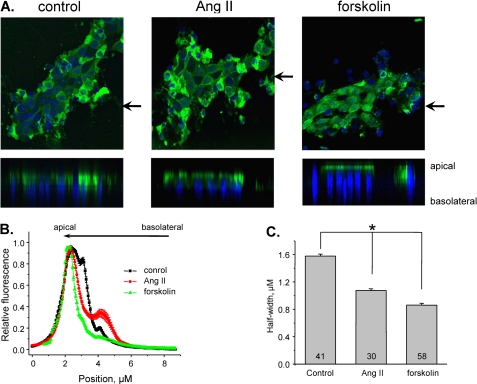
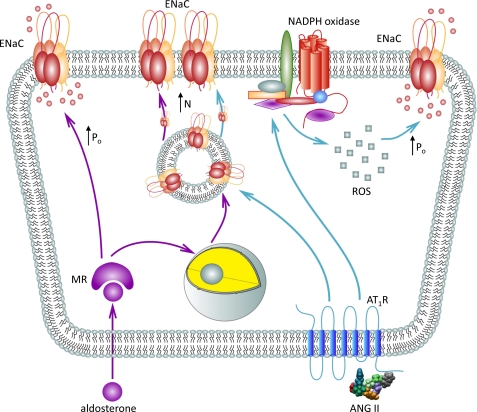
Dietary salt intake controls epithelial Na+ channel (ENaC)-mediated Na+ reabsorption in the distal nephron by affecting status of the renin-angiotensin-aldosterone system (RAAS). Whereas regulation of ENaC by aldosterone is generally accepted, little is known about whether other components of RAAS, such as angiotensin II (Ang II), have nonredundant to aldosterone-stimulatory actions on ENaC. We combined patch clamp electrophysiology and immunohistochemistry in freshly isolated split-opened distal nephrons of mice to determine the mechanism and molecular signaling pathway of Ang II regulation of ENaC. We found that Ang II acutely increases ENaC Po, whereas prolonged exposure to Ang II also induces translocation of α-ENaC toward the apical membrane in situ. Ang II actions on ENaC Po persist in the presence of saturated mineralocorticoid status. Moreover, aldosterone fails to stimulate ENaC acutely, suggesting that Ang II and aldosterone have different time frames of ENaC activation. AT1 but not AT2 receptors mediate Ang II actions on ENaC. Unlike its effect in vasculature, Ang II did not increase [Ca2+]i in split-opened distal nephrons as demonstrated using ratiometric Fura-2-based microscopy. However, application of Ang II to mpkCCDc14 cells resulted in generation of reactive oxygen species, as probed with fluorescent methods. Consistently, inhibiting NADPH oxidase with apocynin abolished Ang II-mediated increases in ENaC Po in murine distal nephron. Therefore, we concluded that Ang II directly regulates ENaC activity in the distal nephron, and this effect complements regulation of ENaC by aldosterone. We propose that stimulation of AT1 receptors with subsequent activation of NADPH oxidase signaling pathway mediates Ang II actions on ENaC.


Figures

FIGURE 1.
FIGURE 1.
Angiotensin increases ENaC Po in freshly isolated split-opened ASDNs. A, representative continuous current trace from a cell-attached patch containing at least three ENaCs in the control, under application of 500 nm Ang II, and following washout with regular bath solution. This patch was held at a test potential of Vh = −Vp = −60 mV. Areas of control (1), upon Ang II treatment (2), and washout (3) are shown below at an expanded time scale. Inward Li+ currents are downward. Dashed lines indicate the respective current state with a c denoting the closed state. B, summary graph of ENaC Po changes in response to Ang II and following washing out from paired patch clamp experiments similar to that shown in A. *, significant increase versus control. Error bars, S.E.
FIGURE 2.
FIGURE 2.
Angiotensin increases ENaC Po in a dose-dependent manner. Summary graph of absolute changes in ENaC Po in response to application of 5, 20, 100, and 500 nm Ang II in paired patch clamp experiments is shown. For each individual experiment the absolute changes were calculated as a difference in ENaC Po in the control and after application of a respective concentration of Ang II. Error bars, S.E.
FIGURE 3.
FIGURE 3.
Clamping mineralocorticoids at a high level does not interfere with Ang II actions on ENaC. A, representative continuous current trace from a cell-attached patch monitoring ENaC activity in the control, under application of 100 nm Ang II, and following washout with regular bath solution. For these experiments animals were injected with DOCA for 3 consecutive days prior to the experimentation. Areas of control (1), after Ang II treatment (2), and washout (3) are shown below at an expanded time scale. All other conditions are identical to those described in Fig. 1A. B, summary graph of ENaC Po changes in response to 100 nm Ang II and following washing out from paired patch clamp experiments similar to that shown on A. *, significant increase versus control. C, summary graph comparing actions of 100 nm Ang on average ENaC Po in control and in DOCA-treated mice. *, significant increase versus control basal activity; **, significant increase versus DOCA pretreatment basal activity. Error bars, S.E.
FIGURE 4.
FIGURE 4.
Aldosterone does not acutely affect ENaC Po in freshly isolated split-opened ASDNs. A, representative continuous current trace from a cell-attached patch containing two ENaCs in the control, under application of 10 nm aldosterone, and following washout with regular bath solution. Areas of control (1) and after aldosterone (2) are shown below at an expanded time scale. All other conditions are identical to those described in Fig. 1A. B, summary graph of ENaC Po changes in response to 10 nm aldosterone from paired patch clamp experiments similar to that shown in A. Error bars, S.E.
FIGURE 5.
FIGURE 5.
Ang II increases ENaC activity by stimulating AT1 receptors. A, representative continuous current trace from a cell-attached patch containing a single ENaC in the control, after inhibition of AT1 receptors with a selective antagonist, 1 μm losartan, and following application of 500 nm Ang II in the continued presence of the AT1R antagonist. Areas of control (1), after losartan (2), and following Ang II (3) are shown below with an expanded scale. B, summary graph of ENaC Po changes in response to the AT1R antagonist and following Ang II treatment from paired patch clamp experiments similar to those shown in A. C, representative continuous current trace from a cell-attached patch monitoring ENaC activity in the control, after stimulation of AT2 receptors with a selective agonist, 100 nm CGP42112, and following washout with control solution. Areas of control (1) and after CGP42112 (2) are shown below with an expanded time scale. D, summary graph of ENaC Po changes in response to the AT2R agonist and following washout from paired patch clamp experiments similar to shown in C. Error bars, S.E.
FIGURE 6.
FIGURE 6.
Ang II does not increase [Ca2+]i in ASDN cells. A, average time course of [Ca2+]i changes in individual cells of ASDN in response to 2-min application of 10 μm ATP (shown with a gray bar) and 500 nm Ang II (shown with a black bar). B, average time course of [Ca2+]i changes in individual cells of distal nephron in response to 2-min application of 500 nm Ang II (shown with a black bar) and 10 μm ATP (shown with a gray bar).
FIGURE 7.
FIGURE 7.
Ang II regulation of ENaC does not involve PI3K and PLA2. A, summary graph of ENaC open probability changes in response to inhibition of PI3K with LY294002 (20 μm), application of 500 nm Ang II in the continued presence of the antagonist, and following washout with control solution from paired patch clamp experiments performed on isolated split-opened ASDNs. *, significant decrease versus control; **, significant increase versus +LY294002. B, summary graph of ENaC Po changes in response to inhibition of PLA2 with AACOCF3 (30 μm), application of 500 nm Ang II in the continued presence of the antagonist, and following washout with control solution from paired patch clamp experiments performed on isolated split-opened ASDNs. *, significant decrease versus control; **, significant increase versus + AACOCF3. Error bars, S.E.
FIGURE 8.
FIGURE 8.
Stimulatory effect of Ang II on ENaC is mediated by NADPH oxidase. A, representative continuous current trace from a cell-attached patch containing monitoring ENaC activity in the control, after inhibition of NADPH oxidase with 100 μm apocynin, application of 500 nm Ang II in the continued presence of the former, and following washout with control solution. Areas of control (1), after apocynin (2), and following Ang II (3) are shown below with an expanded scale. B, summary graph of ENaC Po changes in response to the inhibition of NADPH oxidase, Ang II treatment, and washout from paired patch clamp experiments similar to those shown in A. Error bars, S.E.
FIGURE 9.
FIGURE 9.
Ang II induces formation of ROS and stimulates amiloride-sensitive Ioc in mpkCCDc14 cells. A, representative fluorescent micrographs of the mpkCCDc14 cells loaded with the total ROS detection reagent treated with a vehicle (control), 1 μm Ang II, ROS inhibitor (N-acetyl-l-cysteine, negative control), and ROS inducer (pyocyanin, positive control). Scale bar shown is common for all images. B, summary graph of ROS detection experiments (n = 25) displaying the total fluorescence intensity measured from the images of the mpkCCDc14 cells treated with different experimental agents. Background fluorescence level was corrected. *, significant increase versus vehicle. C, summary graph of equivalent Ioc in mpkCCDc14 principal cells in response to 1 μm Ang II. Ang II and vehicle (control) were added at time 0, and the current was normalized to the starting level. Amiloride (10 μm; arrow) was added to the apical membrane at the end of experiments. Values are means ± S.E. (error bars) of at least three experiments for each value.
FIGURE 10.
FIGURE 10.
Prolonged Ang II treatment stimulates ENaC in the ASDNs by increasing both open probability and functional ENaC numbers. A, representative current traces of ENaC activity in the control (top) and after application of 500 nm Ang II for 30 min (bottom). All other conditions are identical to those described in Fig. 1A. B, summary graphs comparing integral ENaC activity (fNPo, left), ENaC open probability (Po, middle), and number of active channels per patch (N, right) for split-opened ASDNs treated with vehicle and Ang II for 30 min. *, significant increase versus control. Error bars, S.E.
FIGURE 11.
FIGURE 11.
Ang II induces translocation of α-ENaC toward the apical membrane. A, representative confocal plane images (top) and corresponding cross-sections of three-dimensional stacks by z axis (bottom) of α-ENaC localization (pseudocolor green) in split-opened ASDNs treated for 30 min with vehicle (left), 500 nm Ang II (middle), and 10 μm forskolin (right). Nuclear DAPI staining is also shown (pseudocolor blue). The positions of cross-section are shown by the arrows. B, distribution of averaged relative fluorescent signals representing α-ENaC localization along a line on z axis crossing a cell upon treatment with vehicle, Ang II, and forskolin. For each individual cell the fluorescent signals were normalized to their corresponding maximal value. The positions of the apical and basolateral sides are shown with arrows at the top. C, summary graph of half-width means for distributions of fluorescent signals shown in B. *, significant decrease versus control. Error bars, S.E.
FIGURE 12.
FIGURE 12.
Principal scheme of ENaC regulation by Ang II in the ASDN.

Similar articles

Cited by

References

    1. Guyton A. C. (1991) Science 252, 1813–1816 - PubMed
    1. Khawaja Z., Wilcox C. S. (2011) Int. J. Hypertens. 2011, 143471. - PMC - PubMed
    1. Garty H., Palmer L. G. (1997) Physiol. Rev. 77, 359–396 - PubMed
    1. Hummler E. (2003) Curr. Hypertens. Rep. 5, 11–18 - PubMed
    1. Lifton R. P., Gharavi A. G., Geller D. S. (2001) Cell 104, 545–556 - PubMed

Publication types

MeSH terms