. 2011 Nov 21;208(12):2429-47.
doi: 10.1084/jem.20111313. Epub 2011 Nov 14.

Deregulation of TDP-43 in amyotrophic lateral sclerosis triggers nuclear factor κB-mediated pathogenic pathways

Affiliations

Deregulation of TDP-43 in amyotrophic lateral sclerosis triggers nuclear factor κB-mediated pathogenic pathways

Vivek Swarup et al. J Exp Med. .

Abstract

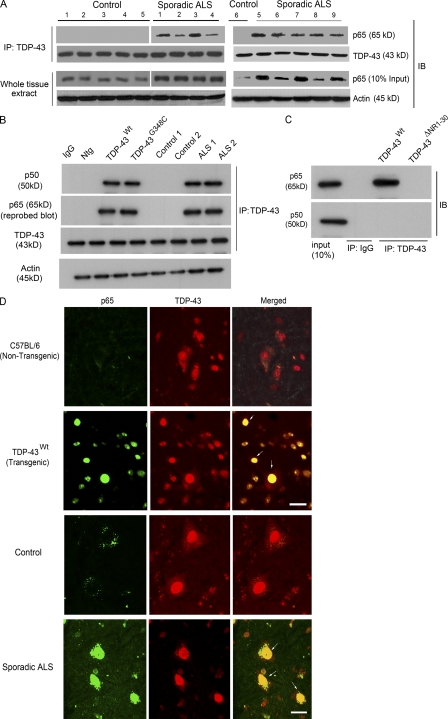
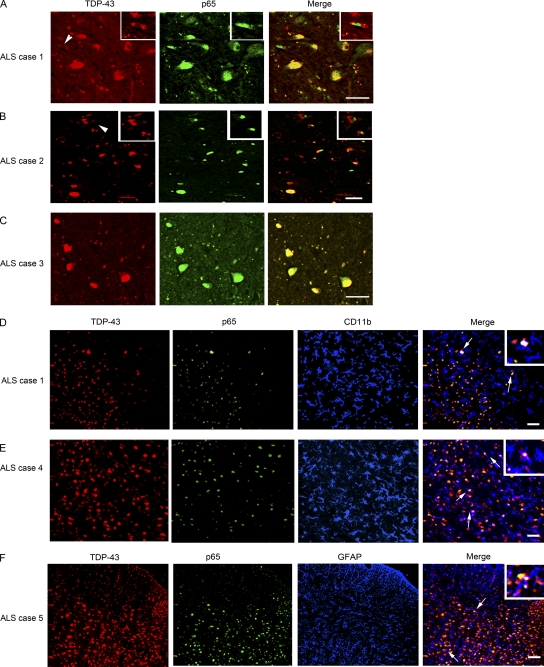
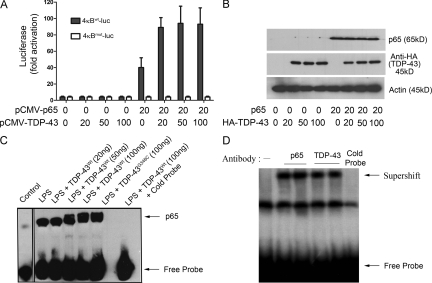
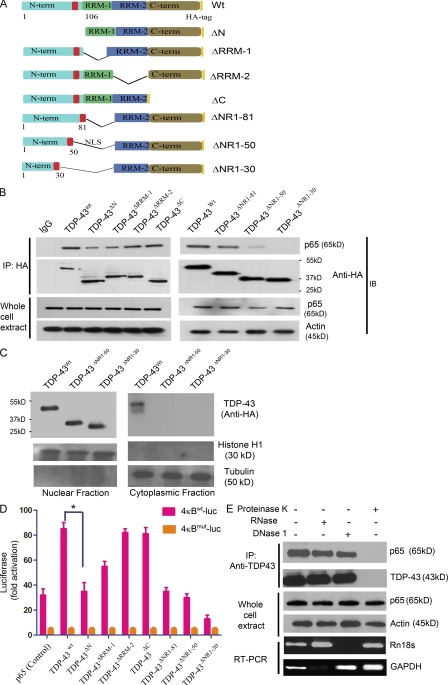
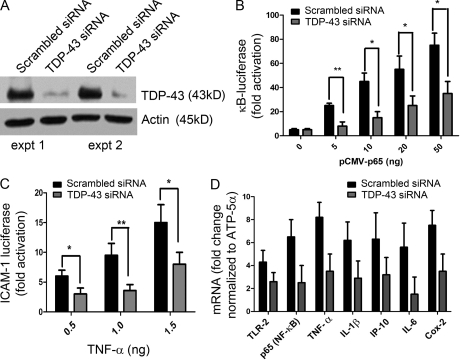
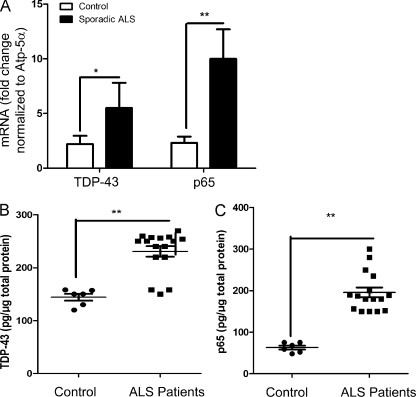
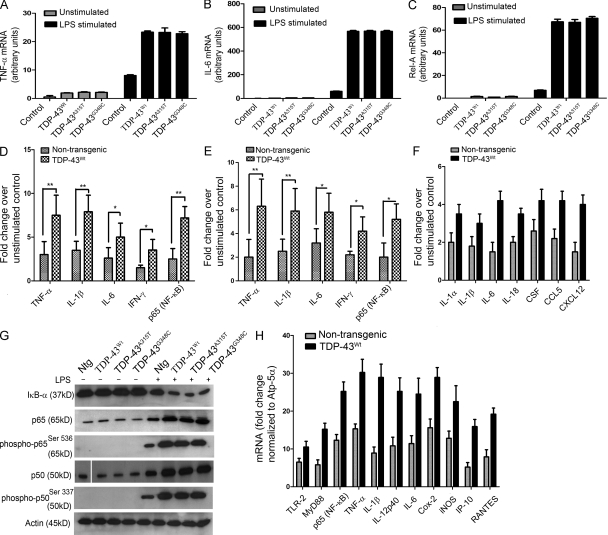
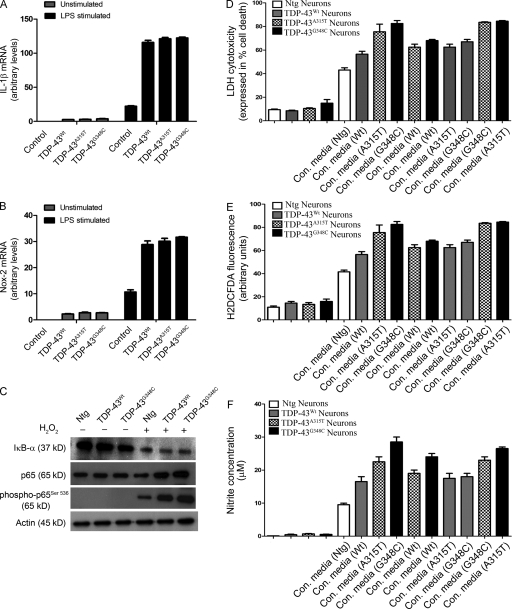
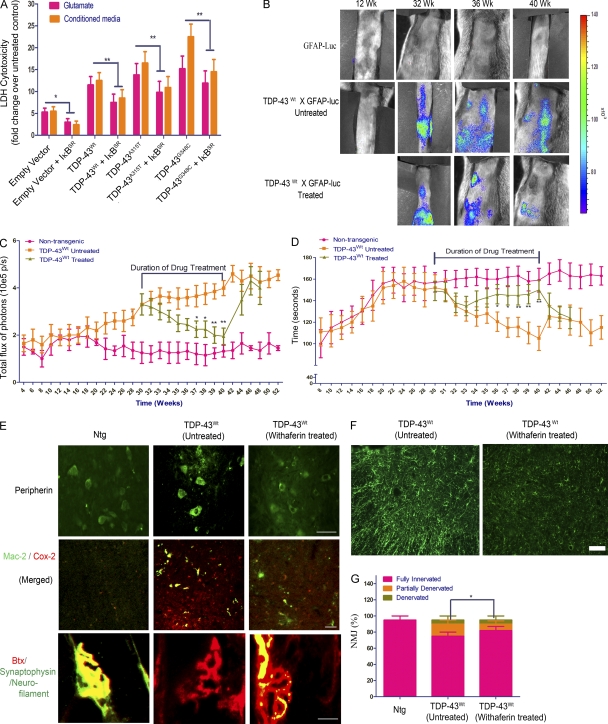
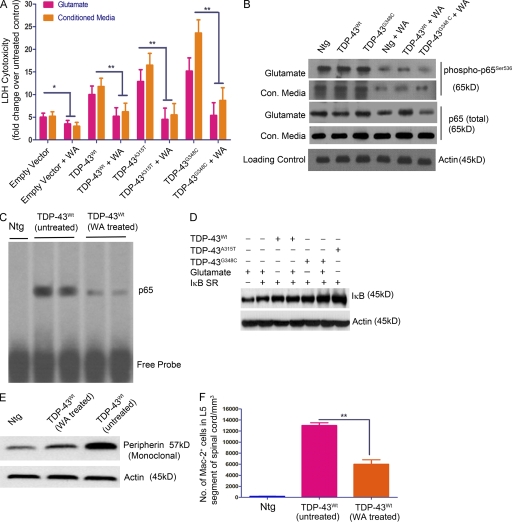
TDP-43 (TAR DNA-binding protein 43) inclusions are a hallmark of amyotrophic lateral sclerosis (ALS). In this study, we report that TDP-43 and nuclear factor κB (NF-κB) p65 messenger RNA and protein expression is higher in spinal cords in ALS patients than healthy individuals. TDP-43 interacts with and colocalizes with p65 in glial and neuronal cells from ALS patients and mice expressing wild-type and mutant TDP-43 transgenes but not in cells from healthy individuals or nontransgenic mice. TDP-43 acted as a co-activator of p65, and glial cells expressing higher amounts of TDP-43 produced more proinflammatory cytokines and neurotoxic mediators after stimulation with lipopolysaccharide or reactive oxygen species. TDP-43 overexpression in neurons also increased their vulnerability to toxic mediators. Treatment of TDP-43 mice with Withaferin A, an inhibitor of NF-κB activity, reduced denervation in the neuromuscular junction and ALS disease symptoms. We propose that TDP-43 deregulation contributes to ALS pathogenesis in part by enhancing NF-κB activation and that NF-κB may constitute a therapeutic target for the disease.


Figures

Figure 1.
Figure 1.
TDP-43 interacts with NF-κB p65. (A) Protein extracts from the spinal cords of nine sporadic ALS subjects (1–9) and six control individuals (1–6) were used for the immunoprecipitation (IP) with TDP-43–specific polyclonal antibody where indicated. Immunoprecipitates or whole cells extracts were subjected to immunoblot (IB) with the indicated antibodies. Two experiments were performed (one with controls 1–5 and ALS patients 1–4, and the other with control 6 and ALS patients 5–9). (B) Total protein extract from spinal cords of TDP-43WT and TDP-43G348C transgenic mice, B6 nontransgenic mice (Ntg), two control individuals, and two sporadic ALS patients were subjected to immunoprecipitation and immunoblot where indicated. (C) Neuro2a cells were transfected with pCMV-p65 and pCMV-p50 expression vectors along with TDP-43WT or TDP-43ΔNR1-30. Extracts were immunoprecipitated with anti–TDP-43 or control IgG where indicated and immunoblotted with anti-p65 and anti-p50. (B and C) A representative blot from two independent experiments is shown. (D) Spinal cords of B6 nontransgenic or TDP-43WT transgenic mice or control or ALS patients were stained with anti-p65 and anti–TDP-43 and analyzed by immunofluorescence. Brightness and contrast adjustments were made to the whole image to make background intensities equal in control and ALS cases. The images represent at least four sections from two experiments using ALS and control patient material. Arrows indicate colocalization of TDP-43 with p65. Bars, 20 µm.
Figure 2.
Figure 2.
TDP-43 colocalizes with p65 in neuronal and glial cells. (A–C) TDP-43 and p65 double immunofluorescence was performed in different sporadic ALS cases as indicated. Double immunofluorescence pictures were taken at various magnifications. Arrowheads represent cytoplasmic localization of TDP-43 and nuclear p65 staining. Insets of higher magnification show cytoplasmic localization of TDP-43 and nuclear p65 staining. (D and E) A three-color immunofluorescence was performed using rabbit TDP-43, mouse p65, and rat CD11b (marker for microglia) as primary antibodies and Alexa Fluor 488 (green), 594 (red), and 633 (far-red, pseudo-color blue) as secondary antibody. Insets of higher magnification show triple colocalization (white) of TDP-43–, p65-, and CD11b-positive cells (arrows). (F) A three-color immunofluorescence was performed using rabbit TDP-43, mouse p65, and rat GFAP (marker for astrocytes) as primary antibodies and Alexa Fluor 488 (green), 594 (red), and 633 (far-red, pseudo-color blue) as secondary antibody. An inset of higher magnification shows triple colocalization (white) of TDP-43–, p65-, and GFAP-positive cells (arrows). (A–F) The images shown are representative of at least four sections from two experiments from ALS patients. Bars, 20 µm.
Figure 3.
Figure 3.
TDP-43 acts as a co-activator of NF-κB p65. (A) BV-2 cells were transfected with 20 ng 4κBWT-luc (containing WT NF-κB–binding sites) or 4κBmut-luc (containing mutated NF-κB–binding sites) together with the indicated amounts of pCMV–TDP-43WT expression plasmid. Cells were harvested 48 h after transfection, and luciferase activity was measured. Values represent the luciferase activity mean ± SEM of three independent transfections, and statistical analysis was performed by two-way ANOVA with Bonferroni adjustment. TDP-43–transfected BV-2 cells were treated with 100 ng/ml LPS. (B) BV-2 cells were transfected with 20 ng pCMV-p65 and various concentrations of pCMV–TDP-43WT. TDP-43 levels are shown when blotted with anti-HA antibody (Sigma-Aldrich), and actin is shown as a loading control. (C) 48 h after transfection, BV-2 cells were harvested, and nuclear extracts were then incubated with NF-κB p65–binding site–specific oligonucleotides coated with streptavidin. EMSA was then performed using the NF-κB EMSA kit. The specificity of the assay was ascertained by adding cold probe. The control lane was performed on a separate EMSA experiment and added. EMSA shown is a representative image of two independent experiments. (D) Supershift assay was performed by adding anti-HA antibody, which specifically recognizes human TDP-43, during the EMSA assay. p65 antibody was also added in a separate lane as a positive control. Note that all the samples were TDP-43 and p65 transfected and LPS stimulated. Supershift EMSA shown is a representative image of two independent experiments.
Figure 4.
Figure 4.
The N-terminal and RRM-1 domains of TDP-43 are crucial for interaction with p65. (A) Two-dimensional cartoon of TDP-43 protein showing various deletion mutants used in this study. Deletion mutants TDP-43ΔN (1–105 aa), TDP-43ΔRRM-1 (106–176 aa), TDP-43ΔRRM-2 (191–262 aa), and TDP-43ΔC (274–414 aa) and full-length TDP-43 (TDP-43WT) are shown. Serial N-terminal and RRM-1 domain deletion mutants are also shown. TDP-43ΔNR1-81 (98–176 aa), TDP-43ΔNR1-50 (51–81 and 98–176 aa), and TDP-43ΔNR1-30 (31–81 and 98–176 aa) were generated. (B) All constructs (WT and deletion mutants) were cloned in pcDNA3.0 with HA tag at the extreme C terminus of the encoded protein. BV-2 cells were transfected with TDP-43WT or deletion constructs and pCMV-p65. 24 h after transfection, cells were harvested and immunoprecipitated (IP) with anti-HA antibody. Immunoprecipitates or whole cells extracts were subjected to immunoblot (IB) with the indicated antibodies. A representative gel from three independent experiments is shown. (C) BV-2 cells transfected with TDP-43WT, TDP-43ΔNR1-50, or TDP-43ΔNR1-30 were fractionated into nuclear and cytoplasmic fractions using sucrose density gradient centrifugation. These fractions were then probed with anti-HA antibody for the expression of transfected TDP-43 species. Histone H1 is used as a nuclear and tubulin as a cytoplasmic marker. A representative gel from two independent experiments is shown. (D) Various deletion mutants of TDP-43 were cotransfected along with 4κBWT-luc (containing WT NF-κB–binding sites) or 4κBmut-luc (containing mutated NF-κB–binding sites). 48 h after transfection, luciferase activity was measured. Statistical analysis was performed by two-way ANOVA with Bonferroni adjustment (*, P < 0.05). Error bars represent mean ± SEM from three independent experiments. (E) TDP-43 antibody was added to BV-2–transfected cell lysates, and proteins were immunoprecipitated with the indicated antibody. After TDP-43 immunoprecipitation, samples were treated with 1 µg/ml proteinase K, 1 µg/ml RNase, or 1 µg/ml DNase 1. To monitor the effectiveness of RNase and DNase digestion, RNase or DNase was added to cell lysates before immunoprecipitation and subjected to PCR. GAPDH RT-PCR was used to monitor RNase digestion, whereas Rn18s gene (which codes for 18SrRNA) genomic PCR was used to monitor DNase digestion. Representative blots and gels from three different experiments are shown.
Figure 5.
Figure 5.
TDP-43 siRNA inhibits activation of NF-κB. BV-2 cells were transfected either with mouse TDP-43 siRNA or scrambled siRNA. 72 h after transfection, some of the cells were either stimulated with 100 ng/ml LPS or mock stimulated for 12 h. (A) Protein extracted from the siRNA experiment was subjected to Western blot analysis. Mouse endogenous TDP-43 levels in TDP-43 siRNA or scrambled siRNA were compared in two different experiments (expt 1 and expt 2) as determined by rabbit polyclonal TDP-43 antibody. (B) Additionally, BV-2 cells were transfected with pCMV-p65 (concentrations as indicated) and 4κBWT-luc vector, and luciferase assay was performed. (C) We transfected BV-2 cells with ICAM-1–luc vector in addition to TDP-43 siRNA or scrambled siRNA in three different experiments. 72 h after transfection, cells were stimulated with varying concentrations (as indicated) of TNF. (D) Real-time quantitative PCR levels of various mRNAs were compared with TDP-43 siRNA–transfected (and LPS stimulated) BMMs and scrambled siRNA–transfected (and LPS stimulated) BMMs. (B-D) Statistical analysis was performed by two-way ANOVA with Bonferroni adjustment (*, P < 0.05; **, P < 0.01). Error bars represent mean ± SEM from three different experiments.
Figure 6.
Figure 6.
Analysis of TDP-43 and NF-κB p65 mRNA expression in sporadic ALS spinal cord. (A) Spinal cord tissue samples from 16 different sporadic ALS patients and 6 controls were subjected to real-time RT-PCR analysis using primers specific for TDP-43 (TARDBP) and p65 (RELA). All real-time RT-PCR values are normalized to Atp-5α levels. (B) Sandwich ELISA was performed for TDP-43 using TDP-43 monoclonal and polyclonal antibodies. After coating the ELISA plates with TDP-43 monoclonal antibody, the plates were incubated with the protein lysates (containing both soluble and insoluble fragments in between) followed by TDP-43 polyclonal antibody and subsequent detection. (C) For p65 ELISA, an ELISA kit from QIAGEN was used. (A–C) Statistical analysis was performed using the unpaired Student’s t test with Welch’s correction (*, P < 0.01; **, P < 0.001). Error bars represent mean ± SEM from three different experiments.
Figure 7.
Figure 7.
Analysis of genes involved in inflammation of mouse microglial and macrophage cells overexpressing human TDP-43. (A–C) Mouse microglial cells BV-2 were either transfected with pCMV–TDP-43WT, pCMV–TDP-43A315T, and pCMV–TDP-43G348C or with empty vectors for 48 h. These cells were then either stimulated with LPS at a concentration of 100 ng/ml or unstimulated (as indicated). 12 h after stimulation, total RNA was extracted with TRIZOL. The total RNA samples were then subjected to real-time quantitative RT-PCR for TNF (A), IL-6 (B), and Rel-A (p65; C). Error bars represent mean ± SEM from five different experiments. (D) Primary microglial cultures from TDP-43WT and B6 nontransgenic mice were stimulated with 100 ng/ml LPS. Proteins from LPS-stimulated microglial cultures were subjected to multianalyte ELISA for inflammatory cytokines and p65. Error bars represent mean ± SEM from four different experiments. (E) Primary microglial cultures from TDP-43WT and B6 nontransgenic mice were treated with 1 mM H2O2 for 1 h and incubated in serum-free media for 12 h to study the effect of ROS. (F) Pure (>90%) primary astrocytes from TDP-43WT and B6 nontransgenic mice were stimulated with LPS and their response studied using real-time PCR for various genes as indicated. (E and F) Error bars represent mean ± SEM from three different experiments. (G) Primary microglial cells from TDP-43WT, TDP-43A315T, TDP-43G348C, and B6 nontransgenic mice (Ntg) were stimulated or unstimulated with LPS. Immunoblots were run to determine the levels of various proteins using specific antibodies as indicated. A representative blot from two independent experiments is shown. (H) BMMs isolated from TDP-43WT and B6 nontransgenic mice were stimulated with 100 ng/ml LPS for 12 h. Total RNA samples were then subjected to real-time quantitative RT-PCR for various genes as indicated. Results are displayed as fold change over unstimulated control. All real-time RT-PCR values are normalized to Atp-5α levels. Error bars represent mean ± SEM from four different experiments. (A–F and H) Statistical analysis was performed by two-way ANOVA with Bonferroni adjustment (*, P < 0.05; **, P < 0.01).
Figure 8.
Figure 8.
TDP-43 up-regulation enhances neuronal vulnerability to death by microglia-mediated cytotoxicity. (A and B) TDP-43 (WT and mutants)–transfected BV-2 cells were stimulated with LPS. 12 h after stimulation, total RNA was extracted with TRIZOL. The total RNA samples were then subjected to real-time quantitative RT-PCR for IL-1β (A) and Nox-2 (B). Error bars represent mean ± SEM from five different experiments. Statistical analysis was performed by two-way ANOVA with Bonferroni adjustment. (C) Primary microglial cells from TDP-43WT, TDP-43A315T, TDP-43G348C, and B6 nontransgenic mice (Ntg) were stimulated or unstimulated with H2O2. Immunoblots were run to determine the levels of various proteins using specific antibodies as indicated. A representative blot from two independent experiments is shown. (D–F) Primary cortical neurons from TDP-43WT, TDP-43A315T, TDP-43G348C, and control B6 nontransgenic mice were incubated with the conditioned media (con. media) derived from primary microglial cells treated with 100 ng/ml LPS. 12 h after challenging cortical cells, cell culture supernatants were used for LDH assay (D). ROS production was determined by H2DCFDA fluorescence (E), and nitrite production was evaluated by Griess reagent (F). Error bars represent mean ± SEM from four independent experiments.
Figure 9.
Figure 9.
Inhibition of NF-κB reduces neuronal vulnerability to toxic injury and ameliorates disease phenotypes in TDP-43 transgenic mice. (A) A stable mutant super-repressive form of IκB-α (IκBSR) was expressed, and its effects on neuronal death were evaluated. The phosphorylation-defective IκB-αS32A/S36A acts by sequestering the cytoplasmic NF-κB pool in a manner that is insensitive to extracellular stimuli. Cultured cortical neurons from TDP-43WT, TDP-43A315T, TDP-43G348C, and B6 nontransgenic mice were transfected with a plasmid construct, expressing IκBSR, and exposed to either 10 µM glutamate for 30 min or incubated in conditioned media from LPS-stimulated microglia of the same genotype. Cytotoxicity to the cells was measured by LDH assay using a commercially available kit. Statistical analysis was performed by two-way ANOVA with Bonferroni adjustment (*, P < 0.05; **, P < 0.01). Data represent mean ± SEM from three independent experiments. (B) In vivo bioluminescence imaging of astrocyte activation was analyzed at various time points in the spinal cord of GFAP-luc/TDP-43WT mice. Typical sequence of images of the spinal cord area obtained from of GFAP-luc/TDP-43WT mice at different time points (12, 32, 36, and 40 wk) by in vivo imaging (n = 10 each group). WA was injected in GFAP-luc/TDP-43WT for 10 wk starting at 30 wk of age until 40 wk. Representative images are shown. (C) Longitudinal quantitative analysis of the total photon GFAP signal/ bioluminescence (total flux of photon/s) in WA-treated and untreated GFAP-luc/TDP-43WT mice and control GFAP-luc mice in the spinal cord is displayed. Duration of drug treatment is indicated. (D) Accelerating rotarod analysis was performed in GFAP-luc/TDP-43WT mice at various ages from 8 wk to 52 wk, and time taken by the mice to fall from the rotarod is used as rotarod performance. WA treatment period is marked as drug treatment period. (C and D) Asterisks represent a statistically significant difference between treated and untreated groups (*, P < 0.05; and **, P < 0.01) using repeated measures two-way ANOVA. (C and D) Error bars represent mean ± SEM (n = 10 each group). (E) Immunofluorescence of spinal cord sections of nontransgenic (Ntg; control), TDP-43WT (untreated), and TDP-43WT (WA treated) mice with polyclonal peripherin antibody is shown. Double immunofluorescence of spinal cord sections with activated microglial marker Mac-2 and Cox-2 is shown. Representative images from four different mice per genotype are shown. NMJ staining was performed using anti-synaptophysin/neurofilament antibodies (green) and α-bungarotoxin (BTX; red). Representative images from four different mice per genotype showing fully innervated muscle in 10-mo-old nontransgenic mice, fully denervated muscle in TDP-43WT mice (untreated), and partially denervated muscle in age-matched WA-treated TDP-43WT mice. (F) Immunofluorescence using GFAP antibody was performed in the spinal cord sections of WA-treated and untreated GFAP-luc/TDP-43WT mice. Representative images from five different mice per genotype are shown. (G) 300 NMJs were counted per animal sample. Frequencies of innervation, partial denervation, and denervation were then converted to percentages and plotted as a graph. Statistical analysis was performed by the Student’s t test. The asterisk represents a statistically significant difference between treated and untreated groups (*, P < 0.01) using repeated measures two-way ANOVA. Error bars represent mean ± SEM from three different experiments. Bars, 20 µm.
Figure 10.
Figure 10.
WA ameliorates TDP-43–mediated toxicity. (A) Primary cortical neurons from TDP-43WT, TDP-43A315T, TDP-43G348C, and B6 nontransgenic mice were exposed to 10 µM glutamate for 15 min or incubated in conditioned media from LPS-stimulated microglia of the same genotype with or without 1 µM WA and were evaluated for LDH cytotoxicity 24 h later. Asterisks represent a statistically significant difference between treated and untreated groups (*, P < 0.05; and **, P < 0.01) using repeated measures two-way ANOVA. Error bars represent mean ± SEM from three independent experiments. (B) Protein samples from cortical neurons (isolated from TDP-43WT, TDP-43A315T, TDP-43G348C, and B6 nontransgenic [Ntg] mice) were subjected to immunoblot against various antibodies as indicated. (C) p65 EMSA was performed on the spinal cord tissue nuclear lysates from WA-treated and untreated GFAP-luc/TDP-43WT mice. A representative EMSA of two independent experiments is shown. (D) IκB levels were measured by Western blot analysis of the cell lysates from cortical neurons of various genotypes as indicated. Actin is shown as loading control. Various conditions are also shown. (E) Western blot analysis of spinal cord sections of nontransgenic (control), TDP-43WT (untreated), and TDP-43WT (WA treated) mice with monoclonal peripherin antibody. (D and E) A representative blot from two different experiments is shown. (F) Quantification of microglial Mac-2–positive cells in the spinal cord sections of nontransgenic (control), TDP-43WT (untreated), and TDP-43WT (WA treated) mice. Mac-2+ cells in TDP-43WT (untreated) L5 spinal cord, 13,000 ± 500/mm3; and TDP-43WT (WA treated) L5 spinal cord, 6,000 ± 300/mm3 (**, P < 0.001). Error bars represent mean ± SEM for four mice of each genotype.

Similar articles

Cited by

References

    1. Aleyasin H., Cregan S.P., Iyirhiaro G., O’Hare M.J., Callaghan S.M., Slack R.S., Park D.S. 2004. Nuclear factor-(kappa)B modulates the p53 response in neurons exposed to DNA damage. J. Neurosci. 24:2963–2973 10.1523/JNEUROSCI.0155-04.2004 - DOI - PMC - PubMed
    1. Arai T., Hasegawa M., Akiyama H., Ikeda K., Nonaka T., Mori H., Mann D., Tsuchiya K., Yoshida M., Hashizume Y., Oda T. 2006. TDP-43 is a component of ubiquitin-positive tau-negative inclusions in frontotemporal lobar degeneration and amyotrophic lateral sclerosis. Biochem. Biophys. Res. Commun. 351:602–611 10.1016/j.bbrc.2006.10.093 - DOI - PubMed
    1. Badadani M., Nalbandian A., Watts G.D., Vesa J., Kitazawa M., Su H., Tanaja J., Dec E., Wallace D.C., Mukherjee J., et al. 2010. VCP associated inclusion body myopathy and paget disease of bone knock-in mouse model exhibits tissue pathology typical of human disease. PLoS ONE. 5:e13183 10.1371/journal.pone.0013183 - DOI - PMC - PubMed
    1. Bäumer D., Parkinson N., Talbot K. 2009. TARDBP in amyotrophic lateral sclerosis: identification of a novel variant but absence of copy number variation. J. Neurol. Neurosurg. Psychiatry. 80:1283–1285 10.1136/jnnp.2008.166512 - DOI - PubMed
    1. Bergmann M., Hart L., Lindsay M., Barnes P.J., Newton R. 1998. IkappaBalpha degradation and nuclear factor-kappaB DNA binding are insufficient for interleukin-1beta and tumor necrosis factor-alpha-induced kappaB-dependent transcription. Requirement for an additional activation pathway. J. Biol. Chem. 273:6607–6610 10.1074/jbc.273.12.6607 - DOI - PubMed

Publication types

MeSH terms

Associated data