

CENP-A exceeds microtubule attachment sites in centromere clusters of both budding and fission yeast
- PMID: 22084306
- PMCID: PMC3257534
- DOI: 10.1083/jcb.201106078
CENP-A exceeds microtubule attachment sites in centromere clusters of both budding and fission yeast
Abstract
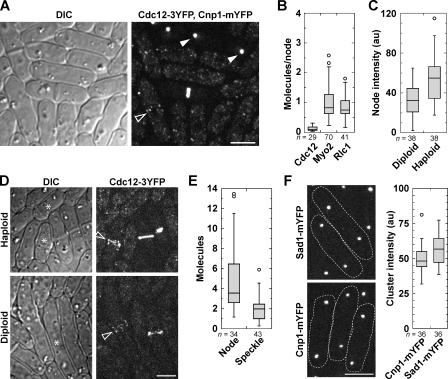
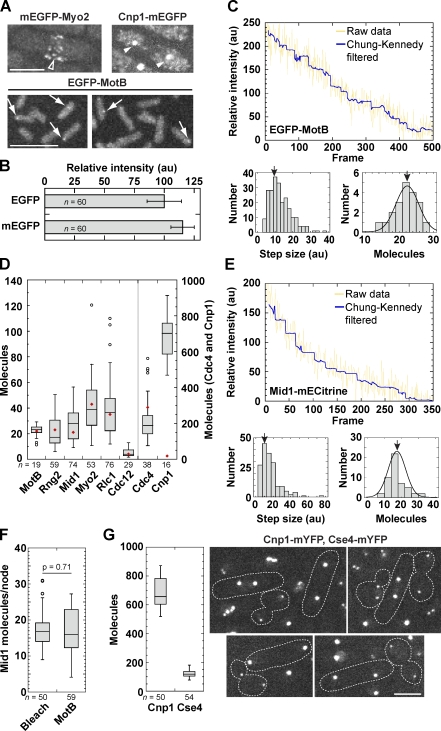
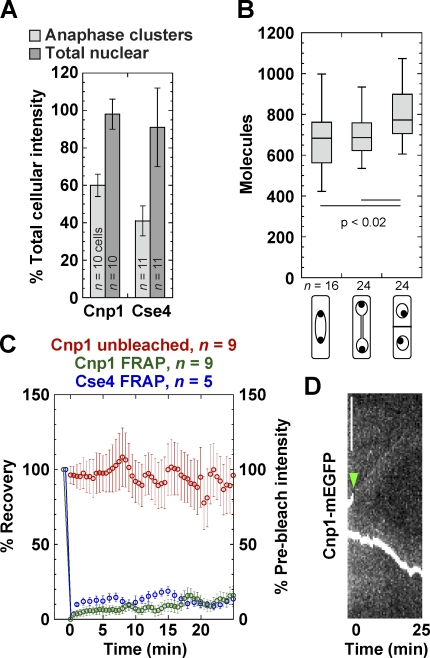
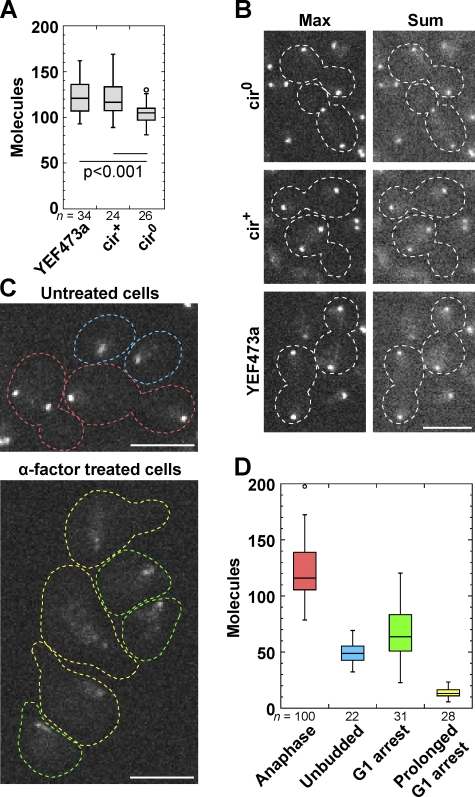
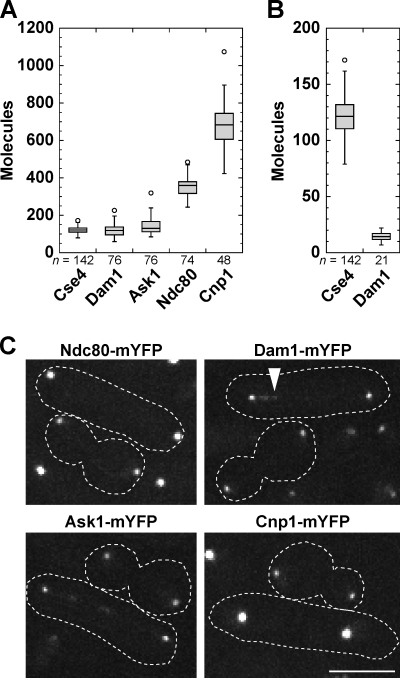
The stoichiometries of kinetochores and their constituent proteins in yeast and vertebrate cells were determined using the histone H3 variant CENP-A, known as Cse4 in budding yeast, as a counting standard. One Cse4-containing nucleosome exists in the centromere (CEN) of each chromosome, so it has been assumed that each anaphase CEN/kinetochore cluster contains 32 Cse4 molecules. We report that anaphase CEN clusters instead contained approximately fourfold more Cse4 in Saccharomyces cerevisiae and ~40-fold more CENP-A (Cnp1) in Schizosaccharomyces pombe than predicted. These results suggest that the number of CENP-A molecules exceeds the number of kinetochore-microtubule (MT) attachment sites on each chromosome and that CENP-A is not the sole determinant of kinetochore assembly sites in either yeast. In addition, we show that fission yeast has enough Dam1-DASH complex for ring formation around attached MTs. The results of this study suggest the need for significant revision of existing CEN/kinetochore architectural models.
© 2011 Coffman et al.
Figures
Similar articles
-
Point centromeres contain more than a single centromere-specific Cse4 (CENP-A) nucleosome.J Cell Biol. 2011 Nov 14;195(4):573-82. doi: 10.1083/jcb.201106036. J Cell Biol. 2011. PMID: 22084307 Free PMC article.
-
Localization and function of budding yeast CENP-A depends upon kinetochore protein interactions and is independent of canonical centromere sequence.Cell Rep. 2014 Dec 24;9(6):2027-33. doi: 10.1016/j.celrep.2014.11.037. Epub 2014 Dec 18. Cell Rep. 2014. PMID: 25533342 Free PMC article.
-
Heterochromatin and RNAi regulate centromeres by protecting CENP-A from ubiquitin-mediated degradation.PLoS Genet. 2018 Aug 8;14(8):e1007572. doi: 10.1371/journal.pgen.1007572. eCollection 2018 Aug. PLoS Genet. 2018. PMID: 30089114 Free PMC article.
-
Protein kinases in mitotic phosphorylation of budding yeast CENP-A.Curr Genet. 2019 Dec;65(6):1325-1332. doi: 10.1007/s00294-019-00997-5. Epub 2019 May 22. Curr Genet. 2019. PMID: 31119371 Review.
-
Heterochromatin tells CENP-A where to go.Bioessays. 2008 Jun;30(6):526-9. doi: 10.1002/bies.20763. Bioessays. 2008. PMID: 18478529 Review.
Cited by
-
Flexibility of centromere and kinetochore structures.Trends Genet. 2012 May;28(5):204-12. doi: 10.1016/j.tig.2012.02.003. Epub 2012 Mar 23. Trends Genet. 2012. PMID: 22445183 Free PMC article. Review.
-
Fission yeast Alp14 is a dose-dependent plus end-tracking microtubule polymerase.Mol Biol Cell. 2012 Aug;23(15):2878-90. doi: 10.1091/mbc.E12-03-0205. Epub 2012 Jun 13. Mol Biol Cell. 2012. PMID: 22696680 Free PMC article.
-
Cortical regulation of cell size by a sizer cdr2p.Elife. 2014 Mar 18;3:e02040. doi: 10.7554/eLife.02040. Elife. 2014. PMID: 24642412 Free PMC article.
-
A dynamical model of the spindle position checkpoint.Mol Syst Biol. 2012 May 8;8:582. doi: 10.1038/msb.2012.15. Mol Syst Biol. 2012. PMID: 22580890 Free PMC article.
-
Self-association of the Gal4 inhibitor protein Gal80 is impaired by Gal3: evidence for a new mechanism in the GAL gene switch.Mol Cell Biol. 2013 Sep;33(18):3667-74. doi: 10.1128/MCB.00646-12. Epub 2013 Jul 15. Mol Cell Biol. 2013. PMID: 23858060 Free PMC article.
References
-
- Bähler J., Wu J.-Q., Longtine M.S., Shah N.G., McKenzie A., III, Steever A.B., Wach A., Philippsen P., Pringle J.R. 1998. Heterologous modules for efficient and versatile PCR-based gene targeting in Schizosaccharomyces pombe. Yeast. 14:943–951 10.1002/(SICI)1097-0061(199807)14:10<943::AID-YEA292>3.0.CO;2-Y - DOI - PubMed
Publication types
MeSH terms
Substances
Grants and funding
LinkOut - more resources
Full Text Sources
Molecular Biology Databases
