. 2012 Feb;30(2):187-96.
doi: 10.1002/stem.780.

In vivo fate mapping identifies mesenchymal progenitor cells

Affiliations

In vivo fate mapping identifies mesenchymal progenitor cells

Danka Grcevic et al. Stem Cells. 2012 Feb.

Abstract

Adult mesenchymal progenitor cells have enormous potential for use in regenerative medicine. However, the true identity of the progenitors in vivo and their progeny has not been precisely defined. We hypothesize that cells expressing a smooth muscle α-actin promoter (αSMA)-directed Cre transgene represent mesenchymal progenitors of adult bone tissue. By combining complementary colors in combination with transgenes activating at mature stages of the lineage, we characterized the phenotype and confirmed the ability of isolated αSMA(+) cells to progress from a progenitor to fully mature state. In vivo lineage tracing experiments using a new bone formation model confirmed the osteogenic phenotype of αSMA(+) cells. In vitro analysis of the in vivo-labeled SMA9(+) cells supported their differentiation potential into mesenchymal lineages. Using a fracture-healing model, αSMA9(+) cells served as a pool of fibrocartilage and skeletal progenitors. Confirmation of the transition of αSMA9(+) progenitor cells to mature osteoblasts during fracture healing was assessed by activation of bone-specific Col2.3emd transgene. Our findings provide a novel in vivo identification of defined population of mesenchymal progenitor cells with active role in bone remodeling and regeneration.


Figures

Figure 1
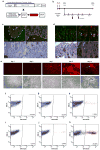
Figure 1. αSMAcherry expressing cells display osteoprogenitor potential
(a–d) The expression of αSMAcherry is localized to the perivascular area of capillaries within periosteum and muscle (a–b, see arrows) and bone marrow (c–d, arrowheads). (e–h) FACS analysis for αSMAcherry expression in samples derived from enzymatically digested periosteum (e–f) or whole bone marrow from transgenic (g–h) or non-transgenic mice (e, g). Proportion of αSMAcherry expressing cells is indicated in the right lower corner of the plots (four αSMAcherry mice were analyzed individually and the respresentative values are shown). (i–j) Primary BMSC derived from αSMAcherry/Col2.3cyan mice were grown for 7 days and imaged under transmitted (left), red (middle) and blue (right) epifluorescence. αSMAcherry expression was present in fibroblastic shaped cells while no expression of Col2.3cyan was detected (i). αSMAcherry-expressing cells (j, left panel, 23% of cells) were collected by FACS sorting; reanalysis of the sorted population purity is shown for αSMAcherry and αSMAcherry+ cells (j, middle and left panels). (k–l) Following sorting, cells were replated and induced to osteogenesis and FACS analyzed on day 7. αSMAcherry cells did not activate Col2.3cyan (k) while α-SMAcherry+ showed differentiation into Col2.3cyan+ cells (l). Col2.3cyan was detected at day 14 in population of differentiated α-SMAcherry+ cells (n), with no expression in α-SMAcherry population (m). (o–p) Alkaline phosphatase expression and mineralization (arrows) was detected inαSMAcherry+ cells in contrast to αSMAcherry cells (o). Real-time PCR shows increased expression of BSP and OC after osteogenic induction of α-SMAcherry+ cells (p).
Figure 2
Figure 2. Cell lineage tracing experiments following in vivo transgene activation
(a) TheαSMACreERT2 transgenic construct harboring sequence of αSMA regulatory elements. These mice were crossed with a Cre recombinase reporter strain Ai9. In dual expressing SMA9 mice tamoxifen-induced Cre recombinase activates expression of tdTomato. (b) Diagram of experimental approach for the cell lineage tracing experiments. Mice were sacrificed on day 2 and 17 following tamoxifen treatment and evaluated by histological analysis. Primary BMSC were established from mice treated with tamoxifen and sacrificed on day 2 after treatment. (c–d) Histological analysis of SMA9 recombination identifies SMA9+ cells within the trabecular area (TR) but not inside the bone matrix (arrowheads). No expression is observed in the growth plate (GP) chondrocytes. Seventeen days after the initial evaluation (day 17) we could track the SMA9+ cells to osteoblasts lining trabecular bone (d, arrowheads) and ostecytes embedded within bone (arrows). Shown are representative images of 6–7 mice per group analyzed at each time point. (e) Epifluorescent imaging of primary BMSC derived from SMA9 mice treated with tamoxifen. Once labeled in vivo, SMA9+ cells expanded during the first week in culture formed nodules and underwent mineralization (see arrow). (f–k) FACS analysis of primary BMSC (days 3 (f–h) and 7 (j–k)) derived from SMA9+ labeled cells following tamoxifen injection in vivo was performed onαSMACreERT2negative/Ai9 mice treated with tamoxifen (f, i), and SMA9 mice without treatment (g, j) served as a controls. In vivo treatment labeled SMA9+ cells account for about 1% of cells on day 3 and close to 25% on day 7 of the culture (h, k).
Figure 3
Figure 3. Multilineage potential of SMA9 progenitor cells
(a–f) Primary BMSC were established from SMA9/Col2.3emd and SMA9/AP2cyan mice treated with tamoxifen for 2 days. Cells were then grown to confluence and induced to osteogenic or adipogenic differentiation respectively. Osteogenic differentiation was confirmed by dual expression of red-labeled SMA9 (b), and green-labeled Col2.3emd osteoblast lineage cells (c), (phase is shown in a). Adipogenic differentiation was confirmed by dual expression of red-labeled SMA9 (e), and blue labeled AP2cyan adipocytes (f), (phase is shown in d). (g–i) To evaluate chondrogenesis cells derived from SMA9 mice cells were cultured for 7 days, and then sorted into SMA9+ and SMA9 and placed under chondrogenic conditions for 9 days. Formation of chondrogenic nodules was detected using alcian blue staining in sorted SMA9+ cells (i), in contrast to SMA (h) and unsorted BMSC (g).
Figure 4
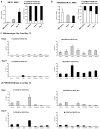
Figure 4. Distinct phenotype of αSMACre labeled cells from the bone marrow compartment and periosteum
(a–b) Left-side graphs present FACS analysis of the percentage of αSMAcherry and SMA9 labeled cells (SMA9+) (2 and 17 days following tamoxifen injection) within the bone marrow (a) and among periosteal cells (b). Right-side graphs present relative proportion of (CD45/Ter119/Cd11b)+ vs. (CD45/Ter119/Cd11b) populations among αSMAcherry and SMA9+ cells. Each group included 2–3 independent samples pooled from the respective tissue of 2–3 mice. To determine the percentage of SMA9+ cells at least 2.5×10⁶ cells for bone marrow and 0.25×10⁶ for periosteal cells were analyzed. Gates were set in accord to the control populations from tamoxifen injected αSMACrenegative/Ai9 mice. Mice without tamoxifen treatment, carrying the transgene SMA9 served for the Cre-leakage control and contained a percentage of tdTomato+ cells comparable to the control mice (not shown). (c–d). Phenotyping of SMA9+ cells 2 and 17 days following transgene activation. Graphs represent the percentage of the population expressing respective mesenchymal cell markers within (CD45/Ter119/Cd11b)+ vs. (CD45/Ter119/Cd11b) compartments of the SMA9+ cells. FACS analysis was performed by gating SMA9+ cells and plotting them using markers for hematopoietic lineage (CD45/Ter119/CD11b) vs respective proposed mesenchymal lineage marker (Sca1, CD90, CD31, CD51 Cd140b, CD146 or CD106) within the bone marrow (c) and periosteal cell populations (d). Values represent mean±SD of the percentage of respective population from 2–3 independent samples pooled from 2–3 mice.
Figure 5
Figure 5. Mesenchymal progenitor cell lineage tracing during fracture healing
(a–b) Osteogenesis during fracture healing is examined at one and two weeks following fracture. The expression of SMA9 is detected in the periosteal layer of cells (a, arrowheads point to the expanded SMA9+ cells within periosteum) located in the proximity to the fracture site (indicated by perforated lines; CB-cortical bone, BM-bone marrow). One week after fracture SMA9+ cells comprise most of the periosteal layer around fracture site. Bone marrow is also filled with SMA9+ cells. Two weeks after the fracture new cartilaginous callus formation is observed (b, arrowheads), while new bone formation is detected by deposition of calcein (green). Osteogenic lineage cells labeled by the SMA9 reporter (red, tdTomato+) persist in proximity to the large and intermingled calcein labeled areas within the callus. (c) Two week post fracture callus of a SMA9 control mouse (tamoxifen non treated) showing extensive calcein labeling but minimal reporter leakage. (d–e) The same experimental design was completed in a SMA9/Col2.3emd model. The expression of SMA9+ cells (d, red,) co-localizes with the expression of osteoblast specific marker Col2.3emd (e, green), as indicated by the presence of yellow color (overlay image, f). To provide better orientation within the area of callus same sections were stained by hematoxylin (g).
Figure 6
Figure 6. SMA9+ cells contribute to new bone formation following fracture healing
(a–c) Osteogenesis following fracture healing and callus remodeling is examined at 6 weeks following fractures. The expression of SMA9 (a), Col2.3emd (b) and the overlayed image was evaluated for the presence of the dual expressing mature osteoblast lineage cells (c). Hematoxylin staining of the same section has been completed following epifluorescence imaging (d). The expression of SMA9 is detected in the periosteal layer of cells (a, c, see arrowheads point to the expanded SMA9+ cells within periosteum), within the osteoblast layer (c, indicated by arrows), among osteocytes and within the muscle. High magnification (20x) clearly identifies the presence of numerous cells that express both SMA9 and Col2.3emd markers (c, see yellow cells on the bone surface and within the bone matrix). BM- bone marrow, and CB-cortical bone. For this experiment unilateral fractures were performed in 3 mice.

Similar articles

Cited by

References

    1. Bianco P, Riminucci M, Gronthos S, et al. Bone marrow stromal stem cells: nature, biology, and potential applications. Stem Cells. 2001;19:180–192. - PubMed
    1. Gronthos S, Zannettino AC, Hay SJ, et al. Molecular and cellular characterisation of highly purified stromal stem cells derived from human bone marrow. J Cell Sci. 2003;116:1827–1835. - PubMed
    1. Shi S, Gronthos S. Perivascular niche of postnatal mesenchymal stem cells in human bone marrow and dental pulp. J Bone Miner Res. 2003;18:696–704. - PubMed
    1. Sacchetti B, Funari A, Michienzi S, et al. Self-renewing osteoprogenitors in bone marrow sinusoids can organize a hematopoietic microenvironment. Cell. 2007;131:324–336. - PubMed
    1. Crisan M, Yap S, Casteilla L, et al. A perivascular origin for mesenchymal stem cells in multiple human organs. Cell Stem Cell. 2008;3:301–313. - PubMed

Publication types

MeSH terms