Effects of A-CREB, a dominant negative inhibitor of CREB, on the expression of c-fos and other immediate early genes in the rat SON during hyperosmotic stimulation in vivo
- PMID: 22079318
- PMCID: PMC5079538
- DOI: 10.1016/j.brainres.2011.10.033
Effects of A-CREB, a dominant negative inhibitor of CREB, on the expression of c-fos and other immediate early genes in the rat SON during hyperosmotic stimulation in vivo
Abstract
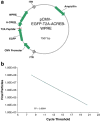
Intraperitoneal administration of hypertonic saline to the rat supraoptic nucleus (SON) increases the expression of several immediate early genes (IEG) and the vasopressin gene. These increases have usually been attributed to action of the cyclic-AMP Response Element Binding Protein (CREB). In this paper, we study the role of CREB in these events in vivo by delivering a potent dominant-negative form of CREB, known as A-CREB, to the rat SON through the use of an adeno-associated viral (AAV) vector. Preliminary experiments on HEK 293 cells in vitro showed that the A-CREB vector that we used completely eliminated CREB-induced c-fos expression. We stereotaxically injected this AAV-A-CREB into one SON and a control AAV into the contralateral SON of the same rat. Two weeks following these injections we injected hypertonic saline intraperitoneally into the rat. Using this paradigm, we could measure the relative effects of inhibiting CREB on the induced expression of c-fos, ngfi-a, ngfi-b, and vasopressin genes in the A-CREB AAV injected SON versus the control AAV injected SON in the same rat. We found only a small (20%) decrease of c-fos expression and a 30% decrease of ngfi-b expression in the presence of the A-CREB. There were no significant changes in expression found in the other IEGs nor in vasopressin that were produced by the A-CREB. This suggests that CREB may play only a minor role in the expression of IEGs and vasopressin in the osmotically activated SON in vivo.
Published by Elsevier B.V.
Figures


Similar articles
-
Time course of phosphorylated CREB and Fos-like immunoreactivity in the hypothalamic supraoptic nucleus after salt loading.Brain Res Mol Brain Res. 1995 Mar;29(1):163-71. doi: 10.1016/0169-328x(94)00242-7. Brain Res Mol Brain Res. 1995. PMID: 7769993
-
Expression of immediate early genes and vasopressin heteronuclear RNA in the paraventricular and supraoptic nuclei of rats after acute osmotic stimulus.J Neuroendocrinol. 2005 Apr;17(4):227-37. doi: 10.1111/j.1365-2826.2005.01297.x. J Neuroendocrinol. 2005. PMID: 15842234
-
Neurotransmitter regulation of c-fos and vasopressin gene expression in the rat supraoptic nucleus.Exp Neurol. 2009 Sep;219(1):212-22. doi: 10.1016/j.expneurol.2009.05.019. Epub 2009 May 20. Exp Neurol. 2009. PMID: 19463813 Free PMC article.
-
Alterations of AP-1 and CREB protein DNA binding in rat supraoptic and paraventricular nuclei by acute and repeated hyperosmotic stress.Brain Res Bull. 2001 Jun;55(3):347-58. doi: 10.1016/s0361-9230(01)00520-2. Brain Res Bull. 2001. PMID: 11489342
-
Rasd1, a small G protein with a big role in the hypothalamic response to neuronal activation.Mol Brain. 2016 Jan 7;9:1. doi: 10.1186/s13041-015-0182-2. Mol Brain. 2016. PMID: 26739966 Free PMC article.
Cited by
-
Introducing Genes With Significant Role in Migraine: An Interactomic Approach.Basic Clin Neurosci. 2019 Jul-Aug;10(4):363-372. doi: 10.32598/bcn.10.4.363. Epub 2019 Jul 1. Basic Clin Neurosci. 2019. PMID: 32231773 Free PMC article.
-
A RNA-Seq Analysis of the Rat Supraoptic Nucleus Transcriptome: Effects of Salt Loading on Gene Expression.PLoS One. 2015 Apr 21;10(4):e0124523. doi: 10.1371/journal.pone.0124523. eCollection 2015. PLoS One. 2015. PMID: 25897513 Free PMC article.
-
Expression of a dominant negative PKA mutation in the kidney elicits a diabetes insipidus phenotype.Am J Physiol Renal Physiol. 2015 Mar 15;308(6):F627-38. doi: 10.1152/ajprenal.00222.2014. Epub 2015 Jan 13. Am J Physiol Renal Physiol. 2015. PMID: 25587115 Free PMC article.
-
Transcription factor CREB3L1 mediates cAMP and glucocorticoid regulation of arginine vasopressin gene transcription in the rat hypothalamus.Mol Brain. 2015 Oct 26;8(1):68. doi: 10.1186/s13041-015-0159-1. Mol Brain. 2015. PMID: 26503226 Free PMC article.
-
Spontaneous Glutamatergic Synaptic Activity Regulates Constitutive COX-2 Expression in Neurons: OPPOSING ROLES FOR THE TRANSCRIPTION FACTORS CREB (cAMP RESPONSE ELEMENT BINDING) PROTEIN AND Sp1 (STIMULATORY PROTEIN-1).J Biol Chem. 2016 Dec 30;291(53):27279-27288. doi: 10.1074/jbc.M116.737353. Epub 2016 Nov 14. J Biol Chem. 2016. PMID: 27875294 Free PMC article.
References
-
- Boutillier AL, Barthel F, Roberts JL, Loeffler JP. Beta-adrenergic stimulation of cFOS via protein kinase A is mediated by cAMP regulatory element binding protein (CREB)-dependent and tissue-specific CREB-independent mechanisms in corticotrope cells. J Biol Chem. 1992;267:23520–23526. - PubMed
-
- Cahill MA, Janknecht R, Nordheim A. Signalling pathways: jack of all cascades. Curr Biol. 1996;6:16–19. - PubMed
Publication types
MeSH terms
Substances
Grants and funding
LinkOut - more resources
Full Text Sources
Research Materials
Miscellaneous

