. 2011 Nov 11;147(4):893-906.
doi: 10.1016/j.cell.2011.10.018.

PINK1 and Parkin target Miro for phosphorylation and degradation to arrest mitochondrial motility

Affiliations

PINK1 and Parkin target Miro for phosphorylation and degradation to arrest mitochondrial motility

Xinnan Wang et al. Cell. .

Abstract

Cells keep their energy balance and avoid oxidative stress by regulating mitochondrial movement, distribution, and clearance. We report here that two Parkinson's disease proteins, the Ser/Thr kinase PINK1 and ubiquitin ligase Parkin, participate in this regulation by arresting mitochondrial movement. PINK1 phosphorylates Miro, a component of the primary motor/adaptor complex that anchors kinesin to the mitochondrial surface. The phosphorylation of Miro activates proteasomal degradation of Miro in a Parkin-dependent manner. Removal of Miro from the mitochondrion also detaches kinesin from its surface. By preventing mitochondrial movement, the PINK1/Parkin pathway may quarantine damaged mitochondria prior to their clearance. PINK1 has been shown to act upstream of Parkin, but the mechanism corresponding to this relationship has not been known. We propose that PINK1 phosphorylation of substrates triggers the subsequent action of Parkin and the proteasome.


Figures

Figure 1
Figure 1. PINK1 or Parkin Overexpression Arrests Mitochondria in Rat Hippocampal Axons
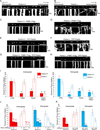
(A–E) Mitochondrial movement in representative axons transfected with mito-dsRed. The first frame of each live-imaging series is shown above a kymograph generated from the movie. The x axis of each represents mitochondrial position and the y axis is time (moving from top to bottom). Vertical white lines correspond to stationary mitochondria and diagonal lines are moving mitochondria. To illustrate the interpretation of kymographs, the lower panels extract only the moving mitochondria, which are shown as red (anterograde) or blue (retrograde) diagonal lines. Axons were tranfected with mito-dsRed alone (A), or together with PINK1-Flag (B), kinase-dead PINK1 (PINK1KD-Flag) (C), PINK1ΔMTS-Flag (D), or YFP-Parkin (E). (F) From kymographs as in (A–E), the percent of time each mitochondrion was in motion was determined and averaged. n=81–136 mitochondria from 8 axons and 4 separate transfections per genotype. * P<0.05, ** P<0.01, *** P<0.001, and error bars represent mean±S.E.M. here and for all figures unless otherwise stated. Scale bars, 10 µm. See also Figure S1, Movies S1, and Tables S1.
Figure 2
Figure 2. PINK1-dependent Mitochondrial Arrest Requires Parkin
Mouse hippocampal axons were transfected with mito-dsRed and analyzed with in kymographs, as in Figure 1. (A) A wildtype(Parkin+/+) axon. (B) A Parkin−/− axon in which mitochondrial movement appears normal. (C, D) Expression of PINK1-Flag arrested mitochondria in a wildtype axon (C) but not in a Parkin−/− axon (D). (E, F) Tranfection with 0.5 µg YFP-Parkin DNA per well arrested mitochondria in wildtype (E), but not Parkin−/− (F) axons. (G, H) Tranfection with 0.5 µg YFP-Parkin DNA allowed PINK1 expression to arrest mitochondria in both wildtype (G) or Parkin−/− (H) axons. (I) From kymographs as in (A–H), the percent of time each mitochondrion was in motion was determined and averaged. n=108–157 mitochondria from 8 axons and 4 separate transfections per genotype. (J) Mitochondrial motility as a function of the amount of transfected YFP-Parkin DNA/well of a 24-well plate. n=97–157 mitochondria from 8 axons and 4 separate transfections per genotype. (K) Movies were taken before and after 15 min incubation with 80 µM Antimycin A and analyzed by kymograph (see Figure S2C–D). n=140–174 mitochondria from 8 axons and 8 separate transfections per genotype. Before Antimycin A, Parkin+/+ and Parkin−/− axons did not significantly differ. P values were calculated by comparing a given genotype to its control in (I), to 0 µg Parkin DNA in (J), and by comparing before and after Antimycin A in (K). Scale bars, 10 µm. See also Figure S2, Movies S2 and Table S2.
Figure 3
Figure 3. PINK1 Functions Upstream of Parkin to Inhibit Mitochondrial Movement in Drosophila CCAP Axons
For each genotype, UAS-mito-GFP was expressed in a single axon within the segmental nerve by CCAP-GAL4. The first frame of the live-imaging series appears above the kymograph. (A) Mitochondrial movement in a control larva. (B–E) PINK1 or hParkin decreased, and PINK1-RNAi or Parkin-RNAi increased mitochondrial movement when expressed in that axon. Expression of hParkin together with PINK1-RNAi arrested mitochondria (F), but expression of PINK1 together with Parkin-RNAi did not (G). (H) From kymographs as in (A–G), the percent of time each mitochondrion was in motion was determined, averaged, and compared with control. n=66–162 mitochondria from 8 axons and 4 animals per genotype. “n.s.”, not significant. Scale bars, 10 µm. See also Movies S3 and Table S3.
Figure 4
Figure 4. The PINK1/Parkin Pathway Causes Miro to be Degraded
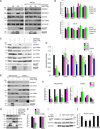
(A, B) Endogenous Miro1 and h-milton1 were degraded by either PINK1 or Parkin expression in a proteasome-dependent manner. HEK293T cells were transfected with PINK1-Flag, PINK1KD-Flag, or YFP-Parkin and grown in the presence or absence of MG132. Cell lysates were analyzed by immunoblot as indicated. n=3 transfections. (C, D) PINK1 and Parkin selectively decrease Miro1 levels and not other mitochondrial proteins. Cells were transfected with PINK1-Flag, YFP-Parkin, or both, or treated with CCCP 20µM for 24 h to promote mitophagy. Lysates were analyzed by immunoblot as indicated. n=3 transfections. In (A–D) quantification was with a fluorescence scanner in the linear range. The intensity of each band was normalized to that of tubulin and expressed relative to normalized levels in control cells. (E, F) PINK1 or Parkin expression in HEK293T cells decreased Miro1, h-milton1, and KHC levels on mitochondria and increased cytosolic h-milton1. For quantification, the intensity of each band was normalized to that of actin and expressed as a fraction of control levels. n=3 transfections. (G, H) PINK1-dependent degradation of Miro requires Parkin. HeLa cells were transfected with PINK1-Flag, or YFP-Parkin, or YFP-Parkin and PINK1-Flag, together with Myc-Miro and SIRT4-Flag (a mitochondrial matrix marker), and cell lysates were analyzed with antibodies to the tagged proteins. (H) The intensity of each Miro1 and SIRT4 band was normalized to the intensity of ATP5β (a mitochondrial matrix loading control) and expressed as a fraction of levels in control cells. n=3 transfections. (I, J) HEK293T cells transfected with Myc-Miro, together with wildtype (wt) Parkin, ParkinR42P, ParkinR275W, or ParkinW453X were lysed and immunoblotted with anti-Myc and detected with a linear range fluorescence scanner. The expression levels of the Parkin constructs were indistinguishable by quantitative immunoblot and one-way Anova: P=0.996, n=4 transfections. (J) Quantifications of Myc-Miro. The intensity of each Myc-Miro band was normalized to the intensity of ATP5β, and the control band was set as 1. n=4 transfections. See also Figure S3.
Figure 5
Figure 5. PINK1 and Parkin Interact with Miro upon Mitochondrial Depolarization
The interactions of PINK1, Parkin, and Miro were examined in HEK293T cells transfected as indicated. For each assay, 50% of the precipitate and 10% of the input were loaded. (A, B) Immunoprecipitations using anti-Myc, anti-Flag or anti-GFP. PINK1-Flag (A) and YFP-Parkin (B) were detected in Myc-Miro immunoprecipitates, and Myc-Miro was detected in PINK1-Flag (A) or YFP-Parkin immunoprecipitates (B). MG132 was used to prevent Myc-Miro degradation. (C, D) Immunoprecipitation of endogenous PINK1 (C) or Parkin (D). Myc-Miro coprecipitated efficiently with anti-PINK1 or anti-Parkin when cells were treated with 40µM CCCP for 10 min. (E, F) HEK293T cells transfected with Myc-Miro were incubated with 10µM CCCP in DMSO or DMSO alone for 3 h prior to lysing the cells. Immunoblots of lysates were probed with anti-Myc and detected with a fluorescence scanner for quantification (F) after normalization to the mitochondrial loading control ATP5β and expressed as a fraction of the control value. n=6 transfections. (G) Cell lysates from HeLa cells transfected as indicated and exposed to CCCP or DMSO as in (E). (H) Quantification of Myc-Miro levels, normalized to ATP5β and expressed as a fraction of the DMSO control. n=4 transfections. See also Figure S4.
Figure 6
Figure 6. PINK1 Phosphorylation of Miro is Necessary for PINK1/Parkin-dependent Miro Degradation
(A) Immunoprecipitated Myc-Miro was recognized by anti-phospho-Threonine only when PINK1-Flag was co-expressed in HEK293T cells. MG132 was present to prevent Miro degradation. (B) PINK1 or PINK1 KD was immunoprecipitated from HEK293T cell lysates and added to bacterially expressed His-tagged Drosophila Miro for an in vitro kinase assay and then probed with anti-phospho-Serine and anti-His. (C) The two phosphopeptides identified in Drosophila Miro by mass spectrometry are aligned with hMiro1. Potential phosphorylation sites that are conserved between the species are marked (*) and a box indicates a potential consensus for a PINK1 target. (D) Miro1-169 can be degraded by PINK1 or Parkin overexpression. Lysates from cells transfected as indicated were immunoblotted with anti-Myc, anti-GFP, anti-Flag and anti-ATP5β. FL, full length. Succinyldehydrogenase (SDHA) is a mitochondrial matrix marker. (E) Quantifications of MiroFL, Miro1-169, Miro170-396 and Miro396-618. The intensity of Myc-Miro bands were normalized to SDHA-Myc levels with the control level set as 1. n=3 transfections. (F) After transfection with wildtype or mutated forms of Myc-Miro and YFP-Parkin, lysates were prepared and immunoprobed with anti-Myc, anti-ATP5β and anti-GFP. (G) Quantifications of Myc-Miro immunoreactivity in (F). The intensity of each Myc-Miro band was normalized to the intensity of ATP5β and the control band was set as 1. n=4 transfections. (H) Cells transfected as indicated were blotted with anti-Myc, anti-ATP5β and anti-Flag. All quantifications were with a fluorescence scanner in the linear range. See also Figure S5.
Figure 7
Figure 7. MiroS156A Prevents Mitochondrial Arrest by PINK1/Parkin Overexpression in Rat Hippocampal Axons
(A,B) Expression of PINK1-Flag (A) or YFP-Parkin (B) at a 3:1 ratio to wild type Miro arrested mitochondria. (C,D) Expression of PINK1-Flag (C) or YFP-Parkin (D) at a 3:1 ratio to MiroS156A did not arrest mitochondria. (E) From kymographs as in (A–D), the percent of time each mitochondrion was in motion was determined and averaged (n=85–153 mitochondria from 8 axons and 4 separate transfections per genotype). (F) Schematic representation of the proposed mechanism of PINK1/Parkin-dependent mitochondrial arrest. Mitochondrial depolarization stabilizes PINK1 on the surface of the mitochondrion, promotes its interaction with Miro, and causes PINK1 to phosphorylate Ser156 of Miro. Subsequent interaction of Parkin with Miro and likely ubiquitination causes Miro to be removed from the membrane and degraded by the proteasome, releasing milton and kinesin from the organelle. Scale bars, 10 µm. See also Figure S6 and Table S4.

Comment in

Similar articles

Cited by

References

    1. Berger AK, Cortese GP, Amodeo KD, Weihofen A, Letai A, LaVoie MJ. Parkin selectively alters the intrinsic threshold for mitochondrial cytochrome c release. Hum. Mol. Genet. 2009;18:4317–4328. - PMC - PubMed
    1. Brickley K, Smith MJ, Beck M, Stephenson FA. GRIF-1 and OIP106, members of a novel gene family of coiled-coil domain proteins: association in vivo and in vitro with kinesin. J. Biol. Chem. 2005;280:14723–14732. - PubMed
    1. Brickley K, Pozo K, Stephenson FA. N-acetylglucosamine transferase is an integral component of a kinesin-directed mitochondrial trafficking complex. Biochim. Biophys. Acta. 2010;1813:269–281. - PubMed
    1. Chan NC, Salazar AM, Pham AH, Sweredoski MJ, Kolawa NJ, Graham RL, Hess S, Chan DC. Broad activation of the ubiquitin-proteasome system by Parkin is critical for mitophagy. Hum. Mol. Genet. 2011 Feb 18; [Epub ahead of print] - PMC - PubMed
    1. Clark IE, Dodson MW, Jiang C, Cao JH, Huh JR, Seol JH, Yoo SJ, Hay BA, Guo M. Drosophila pink1 is required for mitochondrial function and interacts genetically with parkin. Nature. 2006;441:1162–1166. - PubMed

Publication types