Global DNA demethylation during mouse erythropoiesis in vivo
- PMID: 22076376
- PMCID: PMC3230325
- DOI: 10.1126/science.1207306
Global DNA demethylation during mouse erythropoiesis in vivo
Abstract
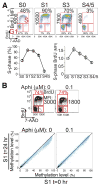
In the mammalian genome, 5'-CpG-3' dinucleotides are frequently methylated, correlating with transcriptional silencing. Genome-wide demethylation is thought to occur only twice during development, in primordial germ cells and in the pre-implantation embryo. These demethylation events are followed by de novo methylation, setting up a pattern inherited throughout development and modified only at tissue-specific loci. We studied DNA methylation in differentiating mouse erythroblasts in vivo by using genomic-scale reduced representation bisulfite sequencing (RRBS). Demethylation at the erythroid-specific β-globin locus was coincident with global DNA demethylation at most genomic elements. Global demethylation was continuous throughout differentiation and required rapid DNA replication. Hence, DNA demethylation can occur globally during somatic cell differentiation, providing an experimental model for its study in development and disease.
Figures


Similar articles
-
DNA methylation represses transcription in vivo.Nat Genet. 1999 Jun;22(2):203-6. doi: 10.1038/9727. Nat Genet. 1999. PMID: 10369268
-
The gamma-globin gene promoter progressively demethylates as the hematopoietic stem progenitor cells differentiate along the erythroid lineage in baboon fetal liver and adult bone marrow.Exp Hematol. 2007 Jan;35(1):48-55. doi: 10.1016/j.exphem.2006.09.001. Exp Hematol. 2007. PMID: 17198873
-
14q32 and let-7 microRNAs regulate transcriptional networks in fetal and adult human erythroblasts.Hum Mol Genet. 2018 Apr 15;27(8):1411-1420. doi: 10.1093/hmg/ddy051. Hum Mol Genet. 2018. PMID: 29432581 Free PMC article.
-
DNA methylation reprogramming of genomic imprints in the mammalian germline: A TET-centric view.Andrology. 2023 Jul;11(5):884-890. doi: 10.1111/andr.13303. Epub 2022 Oct 2. Andrology. 2023. PMID: 36150101 Review.
-
DNA methylation dynamics during the mammalian life cycle.Philos Trans R Soc Lond B Biol Sci. 2013 Jan 5;368(1609):20110328. doi: 10.1098/rstb.2011.0328. Philos Trans R Soc Lond B Biol Sci. 2013. PMID: 23166392 Free PMC article. Review.
Cited by
-
Fine-Tuning of Cholesterol Homeostasis Controls Erythroid Differentiation.Adv Sci (Weinh). 2022 Jan;9(2):e2102669. doi: 10.1002/advs.202102669. Epub 2021 Nov 5. Adv Sci (Weinh). 2022. PMID: 34739188 Free PMC article.
-
S-adenosylmethionine levels regulate the schwann cell DNA methylome.Neuron. 2014 Mar 5;81(5):1024-1039. doi: 10.1016/j.neuron.2014.01.037. Neuron. 2014. PMID: 24607226 Free PMC article.
-
Transcriptional Control of Stem and Progenitor Potential.Curr Stem Cell Rep. 2015 Sep;1(3):139-150. doi: 10.1007/s40778-015-0019-z. Epub 2015 Jun 26. Curr Stem Cell Rep. 2015. PMID: 26509110 Free PMC article.
-
The Poly(C) Binding Protein Pcbp2 and Its Retrotransposed Derivative Pcbp1 Are Independently Essential to Mouse Development.Mol Cell Biol. 2015 Nov 2;36(2):304-19. doi: 10.1128/MCB.00936-15. Print 2016 Jan 15. Mol Cell Biol. 2015. PMID: 26527618 Free PMC article.
-
Genome-wide DNA methylation analysis of the porcine hypothalamus-pituitary-ovary axis.Sci Rep. 2017 Jun 27;7(1):4277. doi: 10.1038/s41598-017-04603-x. Sci Rep. 2017. PMID: 28655931 Free PMC article.
References
Publication types
MeSH terms
Substances
Associated data
- Actions
Grants and funding
LinkOut - more resources
Full Text Sources
Other Literature Sources
Molecular Biology Databases

