Molecular determinants of severe acute respiratory syndrome coronavirus pathogenesis and virulence in young and aged mouse models of human disease
- PMID: 22072787
- PMCID: PMC3255850
- DOI: 10.1128/JVI.05957-11
Molecular determinants of severe acute respiratory syndrome coronavirus pathogenesis and virulence in young and aged mouse models of human disease
Abstract
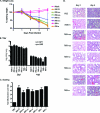
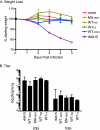
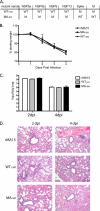
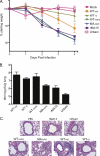
SARS coronavirus (SARS-CoV) causes severe acute respiratory tract disease characterized by diffuse alveolar damage and hyaline membrane formation. This pathology often progresses to acute respiratory distress (such as acute respiratory distress syndrome [ARDS]) and atypical pneumonia in humans, with characteristic age-related mortality rates approaching 50% or more in immunosenescent populations. The molecular basis for the extreme virulence of SARS-CoV remains elusive. Since young and aged (1-year-old) mice do not develop severe clinical disease following infection with wild-type SARS-CoV, a mouse-adapted strain of SARS-CoV (called MA15) was developed and was shown to cause lethal infection in these animals. To understand the genetic contributions to the increased pathogenesis of MA15 in rodents, we used reverse genetics and evaluated the virulence of panels of derivative viruses encoding various combinations of mouse-adapted mutations. We found that mutations in the viral spike (S) glycoprotein and, to a much less rigorous extent, in the nsp9 nonstructural protein, were primarily associated with the acquisition of virulence in young animals. The mutations in S likely increase recognition of the mouse angiotensin-converting enzyme 2 (ACE2) receptor not only in MA15 but also in two additional, independently isolated mouse-adapted SARS-CoVs. In contrast to the findings for young animals, mutations to revert to the wild-type sequence in nsp9 and the S glycoprotein were not sufficient to significantly attenuate the virus compared to other combinations of mouse-adapted mutations in 12-month-old mice. This panel of SARS-CoVs provides novel reagents that we have used to further our understanding of differential, age-related pathogenic mechanisms in mouse models of human disease.
Figures


Similar articles
-
A mouse-adapted SARS-coronavirus causes disease and mortality in BALB/c mice.PLoS Pathog. 2007 Jan;3(1):e5. doi: 10.1371/journal.ppat.0030005. PLoS Pathog. 2007. PMID: 17222058 Free PMC article. Clinical Trial.
-
Severe acute respiratory syndrome coronaviruses with mutations in the E protein are attenuated and promising vaccine candidates.J Virol. 2015 Apr;89(7):3870-87. doi: 10.1128/JVI.03566-14. Epub 2015 Jan 21. J Virol. 2015. PMID: 25609816 Free PMC article.
-
Adaptation of SARS-CoV-2 to ACE2H353K mice reveals new spike residues that drive mouse infection.J Virol. 2024 Jan 23;98(1):e0151023. doi: 10.1128/jvi.01510-23. Epub 2024 Jan 3. J Virol. 2024. PMID: 38168680 Free PMC article.
-
SARS coronavirus accessory proteins.Virus Res. 2008 Apr;133(1):113-21. doi: 10.1016/j.virusres.2007.10.009. Epub 2007 Nov 28. Virus Res. 2008. PMID: 18045721 Free PMC article. Review.
-
Molecular Basis of Pathogenesis of Coronaviruses: A Comparative Genomics Approach to Planetary Health to Prevent Zoonotic Outbreaks in the 21st Century.OMICS. 2020 Nov;24(11):634-644. doi: 10.1089/omi.2020.0131. Epub 2020 Sep 16. OMICS. 2020. PMID: 32940573 Review.
Cited by
-
Exploring the Targets of Novel Corona Virus and Docking-based Screening of Potential Natural Inhibitors to Combat COVID-19.Curr Top Med Chem. 2022;22(29):2410-2434. doi: 10.2174/1568026623666221020163831. Curr Top Med Chem. 2022. PMID: 36281864
-
A live, impaired-fidelity coronavirus vaccine protects in an aged, immunocompromised mouse model of lethal disease.Nat Med. 2012 Dec;18(12):1820-6. doi: 10.1038/nm.2972. Epub 2012 Nov 11. Nat Med. 2012. PMID: 23142821 Free PMC article.
-
A SARS-CoV-2-Related Virus from Malayan Pangolin Causes Lung Infection without Severe Disease in Human ACE2-Transgenic Mice.J Virol. 2023 Feb 28;97(2):e0171922. doi: 10.1128/jvi.01719-22. Epub 2023 Jan 23. J Virol. 2023. PMID: 36688655 Free PMC article.
-
Preclinical characterization of an intravenous coronavirus 3CL protease inhibitor for the potential treatment of COVID19.Nat Commun. 2021 Oct 18;12(1):6055. doi: 10.1038/s41467-021-26239-2. Nat Commun. 2021. PMID: 34663813 Free PMC article.
-
mRNA induced expression of human angiotensin-converting enzyme 2 in mice for the study of the adaptive immune response to severe acute respiratory syndrome coronavirus 2.PLoS Pathog. 2020 Dec 16;16(12):e1009163. doi: 10.1371/journal.ppat.1009163. eCollection 2020 Dec. PLoS Pathog. 2020. PMID: 33326500 Free PMC article.
References
-
- Barthold SW, de Souza MS, Smith AL. 1990. Susceptibility of laboratory mice to intranasal and contact infection with coronaviruses of other species. Lab. Anim. Sci. 40:481–485 - PubMed
-
- Bray M. 2001. The role of the type I interferon response in the resistance of mice to filovirus infection. J. Gen. Virol. 82:1365–1373 - PubMed
Publication types
MeSH terms
Substances
Grants and funding
LinkOut - more resources
Full Text Sources
Other Literature Sources
Molecular Biology Databases
Miscellaneous

