. 2011;6(11):e26631.
doi: 10.1371/journal.pone.0026631. Epub 2011 Nov 1.

Adhesive F-actin waves: a novel integrin-mediated adhesion complex coupled to ventral actin polymerization

Affiliations

Adhesive F-actin waves: a novel integrin-mediated adhesion complex coupled to ventral actin polymerization

Lindsay B Case et al. PLoS One. 2011.

Abstract

At the leading lamellipodium of migrating cells, protrusion of an Arp2/3-nucleated actin network is coupled to formation of integrin-based adhesions, suggesting that Arp2/3-mediated actin polymerization and integrin-dependent adhesion may be mechanistically linked. Arp2/3 also mediates actin polymerization in structures distinct from the lamellipodium, in "ventral F-actin waves" that propagate as spots and wavefronts along the ventral plasma membrane. Here we show that integrins engage the extracellular matrix downstream of ventral F-actin waves in several mammalian cell lines as well as in primary mouse embryonic fibroblasts. These "adhesive F-actin waves" require a cycle of integrin engagement and disengagement to the extracellular matrix for their formation and propagation, and exhibit morphometry and a hierarchical assembly and disassembly mechanism distinct from other integrin-containing structures. After Arp2/3-mediated actin polymerization, zyxin and VASP are co-recruited to adhesive F-actin waves, followed by paxillin and vinculin, and finally talin and integrin. Adhesive F-actin waves thus represent a previously uncharacterized integrin-based adhesion complex associated with Arp2/3-mediated actin polymerization.


Conflict of interest statement

Competing Interests: The authors have declared that no competing interests exist.

Figures

Figure 1
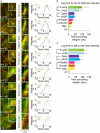
Figure 1. Arp2/3-containing ventral F-actin waves are followed by integrin waves.
(A) LEFT: Total internal reflection fluorescence microscopy (TIRFM) image of a U2OS cell expressing F-tractin-tdtomato to label actin filaments (red) and Arp3-GFP (green). Scale bar = 10 µm. The white asterisk is to aid in orientation of the region. CENTER: Images from a time-lapse series of the region highlighted by a yellow box, time in min shown. Scale bar = 10 µm. The white asterisk is to aid in orientation of the region. RIGHT: Kymograph along the trajectory of ventral F-actin wave propagation (highlighted with a yellow arrow at t = 13 min) demonstrates that F-actin and Arp3 colocalize in space and time. Time in min is on the x-axis and distance in µm is on the y-axis. (B) Histogram of ventral actin wave velocities measured in U2OS cells expressing F-tractin-GFP (n = 42 ventral F-actin waves). To measure ventral F-actin wave velocities, kymographs were made along the trajectory of ventral F-actin wave propagation and the slope of the kymograph was measured. (C) LEFT: TIRFM image of a U2OS cell expressing F-tractin-tdTomato (red) and αV integrin-EGFP (green). The white asterisk is to aid in orientation of the region. Scale bar = 10 µm. CENTER: Images from a time-lapse series of the region highlighted by a yellow box, time in min shown. The white asterisk is to aid in orientation of the region. Scale bar = 10 µm. RIGHT: Kymograph along the trajectory of ventral F-actin wave propagation (highlighted with a yellow arrow at t = 10 min) demonstrates that F-actin temporally precedes αV integrin in ventral F-actin waves. Time in min is on the x-axis and distance in µm is on the y-axis (D) Normalized average intensity of F-tractin-tdTomato (red) and αV integrin-EGFP (green) over time. The average intensity in the green and red channels was measured in the region highlighted by a magenta circle in (C, left) and the values were normalized to the maximal intensity in the time series. To quantify assembly dynamics, we measured the lag time between when ventral F-actin and integrin waves reached half-maximal intensity. To quantify disassembly dynamics, we measured the lag time between when ventral F-actin and integrin waves fell from peak to half-maximal intensity. Lag times are labeled in D. (E) Comparison of lag times with different fluorescent tags. Cells were co-transfected with either F-tractin-tdTomato and αV integrin-EGFP or F-tractin-GFP and αV integrin-tagRFP. Graphs represent lag times between when ventral F-actin and integrin waves reach half-maximal intensity (“Rise to half-max”) as well as when they decrease from peak to half-maximal intensity (“Fall to half-max”). Changing the fluorescent tags did not significantly change the lag time measurements. Values are represented as mean ± SD, n = number of ventral waves analyzed. P-values determined by Student's t-test. (F) Effects of pharmacological perturbation on integrin waves (Bleb = blebbistatin; LatA = latrunculin A; CytoD = cytochalasin D; Rac Inh = NSC23766; PI3K Inh = LY 294002; Dyn = Dynasore hydrate; concentrations below). Cells expressing either αV integrin-tagRFP or αV integrin-EGFP were imaged by TIRFM during perfusion of drugs. We measured the number of waves per min (“frequency”) before and after the drugs were added. We determined the effects of the drugs on integrin waves by dividing the post-drug frequency by the pre-drug frequency for each cell imaged. A value greater than one reflects an increase in wave frequency after drug addition, while a value less than one reflects a decrease in wave frequency after drug addition. n = number of cells analyzed. Data are represented as mean ± SD; P-values determined with Student's t-test.
Figure 2
Figure 2. Melanoma and fibroblast cells exhibit ventral F-actin waves followed by integrin waves.
(A, C) LEFT: Total internal reflection microscopy (TIRFM) image of a B16-F10 cell (A) or a primary mouse fibroblast (C) co-expressing F-tractin-GFP to label actin filaments (green) and αV integrin-tagRFP (red). The white asterisk is to aid in orientation of the region. Scale bar = 10 µm. CENTER: Images from a time-lapse series of the region highlighted by a yellow box, time in min shown. The white asterisk is to aid in orientation of the region. Scale bar = 5 µm. RIGHT: Kymograph (Kym) along the trajectory of ventral F-actin wave propagation (highlighted with a yellow arrow a t = 6 min(A) and t = 8 min(C)) demonstrates that F-tractin-GFP temporally precedes αV integrin-tagRFP in ventral F-actin waves. (B, D) Normalized average intensity of F-tractin-GFP (green) and αV integrin-tagRFP (red) over time. The average intensity in the green and red channels was measured in the region highlighted by a magenta circle in (A,C, left) and the values were normalized to the maximal intensity in the time series. To quantify assembly dynamics, we measured the lag time between when ventral F-actin and integrin waves reached half-maximal intensity. To quantify disassembly dynamics, we measured the lag time between when ventral F-actin and integrin waves fell from peak to half-maximal intensity. Lag times are labeled in (B, D). (E) Average lag times determined as described in (B,D) for the cell types noted, represented as mean ± SD, n = number of ventral F-actin waves analyzed.
Figure 3
Figure 3. Integrin waves are distinct from podosomes and focal adhesions in U2OS cells.
(A) LEFT: Spinning disk confocal and phase-contrast images of a U2OS cell expressing αV integrin-EGFP. Scale bar = 10 µm. RIGHT: Images from a time-lapse series of the region highlighted by a yellow box, time in min shown. The phase contrast image does not exhibit podosome structures as the integrin wave propagates across the ventral surface of the cell. Scale bar = 5 µm. (B) Distance from the cell edge of integrin waves (wave) and focal adhesions (FA) measured in U2OS cells expressing αV integrin-EGFP. Values are represented as mean ± SD; P-values determined with Student's t-test. (C) Area of waves and FAs measured in U2OS cells expressing αV integrin-EGFP. Values are represented as mean ± SD; P-values determined with Student's t-test. (D) Fluorescence density of waves and FAs measured in U2OS cells expressing αV integrin-EGFP. Values are represented as mean ± SD; P-values determined with Student's t-test. (E) Lifetimes of waves and FAs measured in U2OS cells expressing αV integrin-EGFP. FA lifetimes longer than 45 min were recorded as 45 min. Values are represented as mean ± SD; P-values determined with Student's t-test. (F) LEFT: TIRFM image of a cell expressing αV integrin-EGFP. Scale bar = 10 µm. RIGHT: Fluorescent speckle microscopy kymographs of the regions (highlighted with arrows at left) of i) a sliding focal adhesion (FA) and ii) a propagating integrin wave (wave). Magenta lines highlight the path of integrin spekcles within kymographs. Velocity was measured from the slope of the line. (G) Average velocity of integrin speckles within FA or wave structures. Velocity of integrin speckles in FA or waves were measured from the slope of kymographs, as in (F). Integrin speckles in waves remain stationary relative to the substrate. Values are represented as mean ± SD.
Figure 4
Figure 4. Integrin waves and ventral F-actin waves are visible by Interference Reflection Microscopy.
(A) LEFT: Interference reflection microscopy (IRM) and total internal reflection (TIRF) images of a U2OS cell expressing αV integrin-mCherry. Inset (yellow box) shows focal adhesion morphology in IRM and TIRF. Scale bar = 10 µm. RIGHT: Images from a time-lapse series from the regions highlighted by a magenta box, time in min shown. Scale bar = 5 µm. (B) Normalized average intensity of αV integrin-mCherry (red) and inverted IRM intensity (blue) over time in the regions highlighted by a magenta in (A, left). (C) LEFT: Interference reflection microscopy (IRM) and total internal reflection (TIRF) images of a U2OS cell expressing F-tractin-GFP to label actin filaments. Scale bar = 10 µm. RIGHT: Images from a time-lapse series from the regions highlighted by a magenta box, time in min shown. Scale bar = 5 µm. (D) Normalized average intensity of F-tractin-GFP (green) and inverted IRM intesnsity (blue) over time from the region highlighted in (C, left). (E) IRM lag time to rise to half-maximal inverted intensity, relative to rise to half maximal intensity of F-tractin and Integrin. The lag time between when αv integrin or F-tractin reached half-maximal intensity and when IRM reached half-maximal intensity was measured in multiple cells. Actin intensity increase precedes IRM inverted intensity increase, while integrin intensity and IRM inverted intensity increase simultaneously. Values are represented as mean ± SD.
Figure 5
Figure 5. Ventral F-actin and integrin waves require integrin engagement to extracellular matrix (ECM).
(A) Ventral F-actin and integrin waves require ECM. U2OS cells expressing F-tractin-GFP to label actin filaments and αV integrin-tagRFP were plated on either 5 µg/mL fibronectin (FN) or 0.01% poly-L-lysine (PLL). In A, B, and C, cells were imaged for 10 min and the average number of waves per min per µm2 was measured. P-values determined with Student's t-test. n = number of cells analyzed. (B) Ventral F-actin and integrin waves are sensitive to FN concentration. U2OS cells expressing F-tractin-GFP and αV integrin-tagRFP were plated on increasing concentrations of FN (1 µg/mL, 5 µg/mL and 10 µg/mL). (C) Integrin waves require integrin engagement to ECM. U2OS cells expressing F-tractin-GFP and αV integrin-tagRFP were plated on 5 µg/mL FN in the presence of 20 µg/ml LM609 antibody to block αVβ3 binding to FN (“αVβ3”) or 20 µg/ml LM609 antibody + P4C10 (1∶20 dilution) to block αVβ3 and β1 binding to FN (“αVβ31”). (D) Effect of MnCl2 on ventral F-actin and integrin waves. Cells expressing F-tractin-GFP and αV integrin-tagRFP were imaged 15 min prior to and 30 min after perfusion of 2 mM MnCl2. We measured the number of waves per min (“frequency”) before and after MnCl2 was added. We determined the effects of MnCl2 on waves by dividing the post-drug frequency by the pre-drug frequency for each cell imaged. A value greater than one reflects an increase in wave frequency after drug addition, while a value less than one reflects a decrease in wave frequency after drug addition. n = number of cells analyzed. Data are represented as mean ± SD; P-values determined with Student's t-test. (E) Total internal reflection fluorescence microscopy (TIRFM) images of a U2OS cell expressing F-tractin-GFP and αV integrin-tagRFP immediately prior to (LEFT) and after (CENTER) perfusion of 2 mM MnCl2 addition. RIGHT: Kymograph along the trajectory of ventral F-actin wave propagation (highlighted with yellow arrows). MnCl2 stops the propagation of both F-actin and integrin waves. Scale bar = 10 µm.
Figure 6
Figure 6. Focal adhesion (FA) proteins assemble into integrin waves in a precise order.
(A) αV integrin-tagRFP (Int, red) was co-expressed with the following proteins: αV integrin-EGFP (Int, green), talin-EGFP (Tln, green), vinculin-EGFP (Vcl, green), paxillin-EGFP (Pax, green), VASP-Venus (VASP, green), zyxin-EGFP (Zyx, green), Arp3-GFP (Arp, green) and F-tractin-GFP (Act, green). LEFT: Total internal reflection fluorescence microscopy (TIRFM) images showing an inset (yellow box) of a ventral wave. Still image was taken from a time series at the labeled time. Scale bar = 10 µm. Inset scale bar = 5 µm. Yellow arrow indicates region of kymograph measurement. CENTER: Kymograph along the trajectory of integrin wave propagation. The yellow arrow corresponds to the arrow in (A, left) to demonstrate the direction of wave propagation as well as the time the still image corresponds to in the kymograph. Cells imaged at 20s intervals. Kymograph region = 10 µm. RIGHT: Representative quantification of normalized average fluorescence intensity (“Intensity”) over time for ventral waves in cells imaged at 5s intervals. (B) Average lag time between when fluorescence intensity of FA proteins and αV integrin rise to half-maximal. In B and C, the graphs represent the mean and standard deviation of n>10 integrin wave measurements per condition. Brackets denote lag-times that do not significantly differ from each other as determined by Student's t-test (detailed statistics found in Table S1). (C) Average lag time between when fluorescence intensity of FA proteins and αV integrin fall from peak to half-maximal.
Figure 7
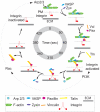
Figure 7. Speculative model of adhesive F-actin wave assembly and disassembly.
Speculative model of adhesive F-actin wave assembly and disassembly, based on the average wave lifetime of 7 min. First, Arp2/3 mediates actin polymerization. ∼50s later, the adapter and actin regulatory proteins zyxin and VASP are co-recruited, likely to regulate F-actin barbed end assembly. This is followed rapidly by co-recruitment of the VASP- and actin-binding protein vinculin and its binding partner the adapter protein paxillin at ∼60s. At 80s, the actin and integrin binding protein talin is recruited, possibly by interaction with vinculin. Talin association with ventral F-actin waves then presumably facilitates the inside-out activation of integrin and induces ECM adhesion. ∼310s after initial polymerization in adhesive F-actin waves, F-actin depolymerizes and Arp2/3 dissociates. By 340s, VASP and zyxin co-disassemble, followed by paxillin, vinculin, and talin co-disassembly at 380s. Finally, at 420s integrin dissociates from adhesive F-actin waves by inactivation, and the membrane is no longer tethered to the substrate. A possible positive feedback loop between integrin adhesion and actin polymerization with unknown timing is denoted by dashed arrows, as described in the discussion.

Similar articles

Cited by

References

    1. Choi CK, Vicente-Manzanares M, Zareno J, Whitmore LA, Mogilner A, et al. Actin and alpha-actinin orchestrate the assembly and maturation of nascent adhesions in a myosin II motor-independent manner. Nat Cell Biol. 2008;10:1039–1050. - PMC - PubMed
    1. Serrels B, Serrels A, Brunton VG, Holt M, McLean GW, et al. Focal adhesion kinase controls actin assembly via a FERM-mediated interaction with the Arp2/3 complex. Nat Cell Biol. 2007;9:1046–1056. - PubMed
    1. DeMali KA, Barlow CA, Burridge K. Recruitment of the Arp2/3 complex to vinculin: coupling membrane protrusion to matrix adhesion. J Cell Biol. 2002;159:881–891. - PMC - PubMed
    1. Goley ED, Welch MD. The ARP2/3 complex: an actin nucleator comes of age. Nat Rev Mol Cell Biol. 2006;7:713–726. - PubMed
    1. Weiner OD, Marganski WA, Wu LZ, Altschuler SJ, Kirschner MW. An actin-based wave generator organizes cell motility. PLoS Biol. 2007;5:e221. - PMC - PubMed

Publication types

MeSH terms