Comparative Study
. 2012 Jan 18;31(2):351-65.
doi: 10.1038/emboj.2011.390. Epub 2011 Nov 8.

FOG-1 and GATA-1 act sequentially to specify definitive megakaryocytic and erythroid progenitors

Affiliations
Comparative Study

FOG-1 and GATA-1 act sequentially to specify definitive megakaryocytic and erythroid progenitors

Elena Mancini et al. EMBO J. .

Abstract

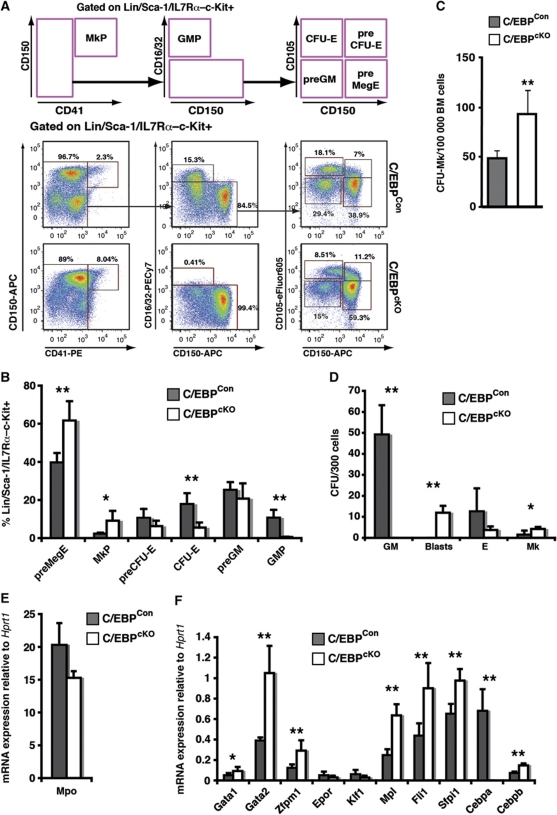
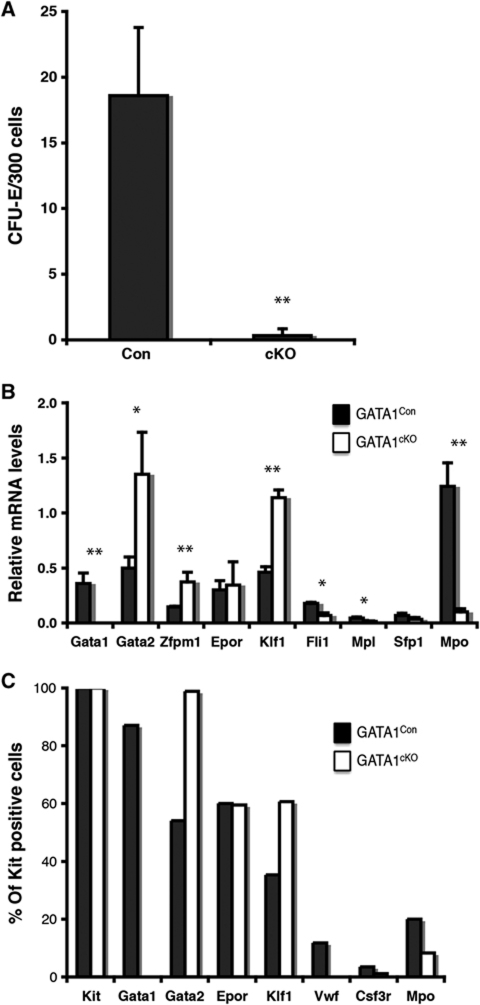
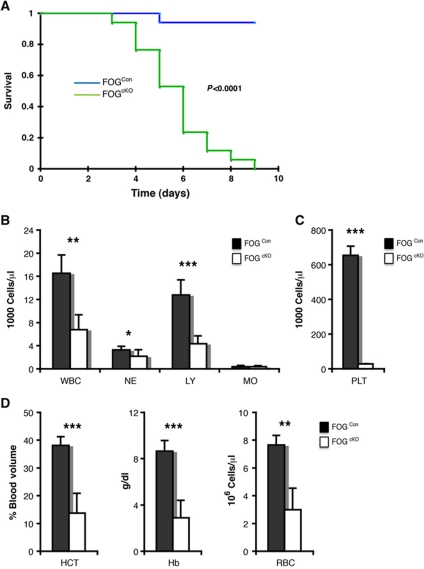
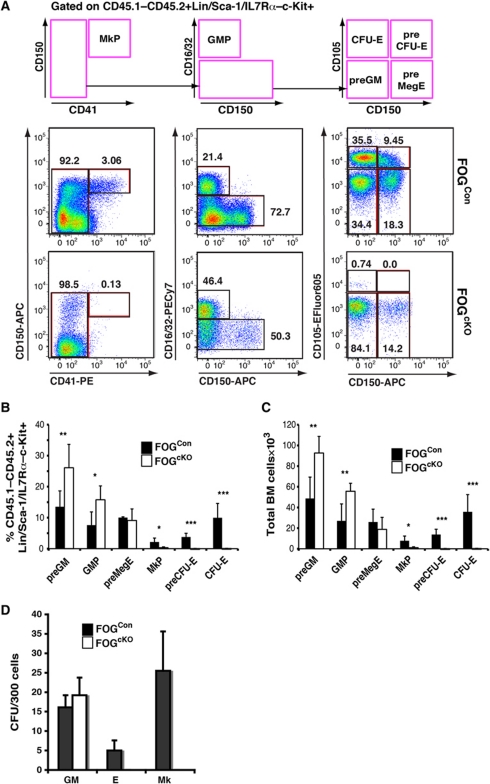
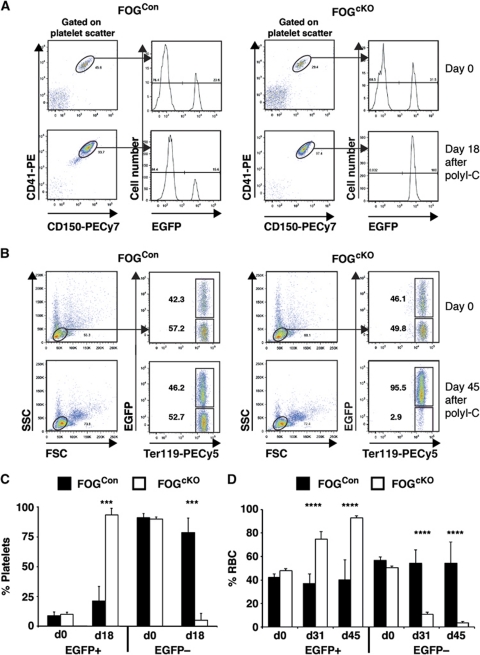
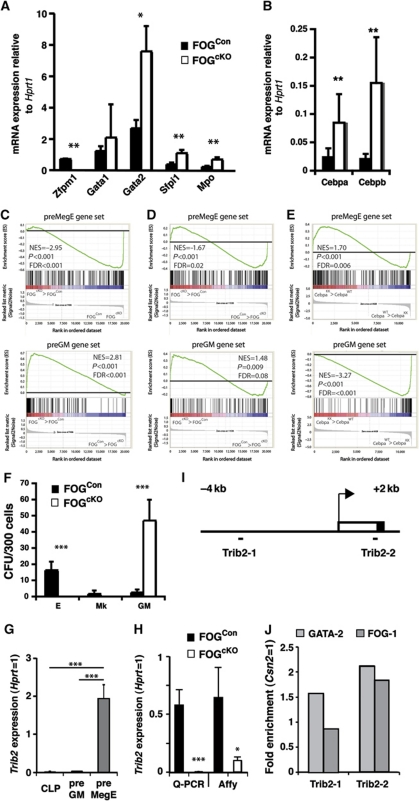
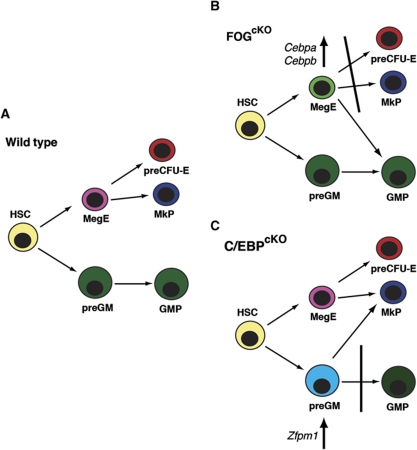
The transcription factors that control lineage specification of haematopoietic stem cells (HSCs) have been well described for the myeloid and lymphoid lineages, whereas transcriptional control of erythroid (E) and megakaryocytic (Mk) fate is less understood. We here use conditional removal of the GATA-1 and FOG-1 transcription factors to identify FOG-1 as required for the formation of all committed Mk- and E-lineage progenitors, whereas GATA-1 was observed to be specifically required for E-lineage commitment. FOG-1-deficient HSCs and preMegEs, the latter normally bipotent for the Mk and E lineages, underwent myeloid transcriptional reprogramming, and formed myeloid, but not erythroid and megakaryocytic cells in vitro. These results identify FOG-1 and GATA-1 as required for formation of bipotent Mk/E progenitors and their E-lineage commitment, respectively, and show that FOG-1 mediates transcriptional Mk/E programming of HSCs as well as their subsequent Mk/E-lineage commitment. Finally, C/EBPs and FOG-1 exhibited transcriptional cross-regulation in early myelo-erythroid progenitors making their functional antagonism a potential mechanism for separation of the myeloid and Mk/E lineages.


Conflict of interest statement

The authors declare that they have no conflict of interest.

Figures

Figure 1
Figure 1
C/EBP depletion expands stem/progenitor cells and activates Mk potential. (A) Representative FACS profiles of C/EBPCon and C/EBPcKO bone marrow 12 days after poly(I-C) treatment. The top panel shows the gating strategy and gates used to define the progenitor populations. (B) Progenitor population sizes determined as in (A) expressed as percentage of the Lin/Sca-1/IL7Rα–c-Kit+ fraction for C/EBPCon (n=4) and C/EBPcKO (n=5) mice. (C) Total C/EBPCon and C/EBPcKO bone marrow cells were plated in MegaCult assays, and the number of Mk colonies determined. Each measurement was performed in quadruplicate. Error bars indicate standard deviations (**P<0.01; Student's t-test). (D) Lineage potential of C/EBPCon and C/EBPcKO preGM cells was assayed separately under GM (M3534), E (M3436) and Mk (MegaCult) conditions. In the case of GM conditions, colonies with immature blast morphology (blasts) are shown separately from normal GM colonies. The average number of colony forming units (CFUs) per 300 cells plated is given. Each value represents the average of four individual mice, each measured in triplicate. (E, F) Gene expression analysis of C/EBPCon and C/EBPcKO preGM cells (C/EBPCon: n=4; C/EBPcKO: n=5). Data show average mRNA expression normalized to Hprt1, each mouse assayed in triplicate. Error bars indicate standard deviations and asterisks indicate statistical significance (*P<0.05; **P<0.01; Student's t-test).
Figure 2
Figure 2
Loss of GATA-1 prevents formation of committed erythroid progenitors. (A) Differential count of peripheral blood cells 12 days after poly(I-C) treatment (GATA-1Con: n=10; GATA-1cKO: n=8). WBCs, total white blood cells; NEs, neutrophils; LYs, lymphocytes; MOs, monocytes; PLT, platelets. (B) Red cell parameters measured as in (A). HCT, haematocrit; Hb, haemoglobin level; RBC, red blood cell count. Error bars show standard deviations. Asterisks indicate statistical significance (*P<0.05; **P<0.0001; ***P<0.00001). (C) Total bone marrow cells from GATA-1Con (left panel) and GATA-1cKO (right panel) mice day 12 after poly(I-C) injection were stained for CD71 and Ter119 to identify erythroid progenitor populations. Values shown are the size of gated populations as percentage of the total number of cells. I, pro-erythroblasts; II, basophilic erythroblasts; III, polychromatophilic erythroblasts; IV, orthochromatophilic erythroblasts. (D) Bar graphs represent percentage of the total number of cells in BM for each population gated as in (C). (E) Representative flow cytometric analysis of the experimental progenitor population from GATA-1Con and GATA-1cKO mice 12 days after poly(I-C) treatment. The schematic representation (top) indicates the gating strategy used for separating the different myelo-erythroid progenitor sub-populations from GATA-1Con (middle panels) and GATA-1cKO (bottom panels). The size of each population as percentage of the parental population is shown next to each gate. (F) Bar graphs represent the average size of each myelo-erythroid progenitor population as percentage of the Lin/Sca-1/IL7Rα–c-Kit+ fraction in GATA-1Con (n=6) and GATA-1cKO (n=6) poly(I-C)-treated mice. (G) Absolute number of myelo-erythroid progenitor from each of the populations analysed in (F). Numbers represent cells retrieved from tibias and femurs of each mouse.
Figure 3
Figure 3
Loss of erythroid colony forming potential by GATA-1-deficient preMegEs. (A) CFU-E forming capacity of GATA-1Con and GATA-1cKO preMegEs. preMegE cells were sorted from GATA-1Con and GATA-1cKO mice 12 days after poly(I-C) injection and assayed for CFU-E activity (M3436). The values represent the average of three individually sorted mice, each assayed in duplicate. (B) Gene expression analysis of GATA-1Con and GATA-1cKO preMegEs obtained as in (A) was performed using real-time PCR. Values represent the average obtained from three individually sorted mice, each assayed in triplicate. Error bars indicate standard deviations and asterisks indicate statistical significance (*P<0.05; **P<0.01; Student's t-test). (C) Single cell level gene expression in GATA-1Con and GATA-1cKO preMegEs analysed by nested multiplex PCR. Values represent the percentage of cells scored as positive for the indicated transcripts. More than 85 single cells were assayed per genotype, and those scoring positive for Kit mRNA were included in the analysis (<3% were negative).
Figure 4
Figure 4
Haematopoietic FOG-1 is essential for survival of adult mice. (A) Kaplan–Meier survival curve of wild-type mice transplanted with FOG1Con (n=17) and FOG1cKO bone marrow cells (n=17) and injected with poly(I-C) (150 μg/mouse) 4 weeks after transplantation. The graph shows the fraction of live mice for each genotype. Statistical significance between groups was calculated using the log-rank test. (B) Differential count of peripheral blood cells 5 days after poly(I-C) treatment (FOG1Con: n=7; FOG1cKO: n=8). WBCs, total white blood cells; NEs, neutrophils; LYs, lymphocytes; MOs, monocytes. (C) Platelet (PLT) count measured as in (B). (D) Red cell parameters measured as in (B). HCT, haematocrit; Hb, haemoglobin level; RBC, red blood cell count. Error bars show standard deviations. Asterisks indicate statistical significance (*P<0.05; **P<0.0001; ***P<0.00001).
Figure 5
Figure 5
FOG-1-deficient haematopoietic stem cells are unable to generate megakaryocyte-erythroid progenitors or colonies. (A) Representative flow cytometric analysis of the experimental progenitor population (CD45.1–CD45.2+Lin/Sca-1/IL7Rα–c-Kit+) from FOGCon (middle panels) and FOGcKO (bottom panels). The schematic representation (top) indicates the gating strategy used for separating the different myelo-erythroid progenitor sub-populations. The size of each population as percentage of the parental population is shown next to each gate. (B) Bar graph showing the average size of each myelo-erythroid progenitor population as percentage of the CD45.1–CD45.2+Lin/Sca-1/IL7Rα–c-Kit+ fraction in FOG1Con (n=10) and FOG1cKO (n=10) competitively transplanted mice. Data were pooled from two independent experiments. (C) Absolute number of myelo-erythroid progenitor from each of the populations analysed in (B). Numbers represent cells retrieved from tibias and femurs of each mouse. (D) Lineage potential in vitro of CD45.1–CD45.2+Lin–Sca-1+c-Kit+Flt3– stem/multipotent progenitor fraction sorted from FOG1Con and FOG1cKO competitively transplanted mice. Three hundred cells were plated in semisolid medium under Mk (MegaCult-C), E (M3436) and GM conditions (M3534), respectively. The lineage potential of each cell population is expressed as the percentage of the total number of colonies formed under all three conditions. Independently transplanted mice (FOG1Con: n=6; FOG1cKO: n=6) were analysed for each genotype in two separate experiments, each performed in triplicate (GM, E) or in quadruplicate (Mk). Error bars show standard deviations and asterisks indicate statistical significance (*P<0.05; **P<0.01; ***P<0.001; Student's t-test).
Figure 6
Figure 6
FOG-1-deficient haematopoiesis does not produce erythrocytes or platelets. (A) CD45.1/2 recipient mice were co-transplanted with 500 000 Vwf-EGFPtg/+ and 2 000 000 of either FOGCon or FOGcKO bone marrow cells. PB was analysed by flow cytometry 4 weeks after transplantation. Mice were then injected with poly(I-C). Eighteen days after the first poly(I-C) injection (two injections, 2 day intervals) PB analysis was performed. Platelets were identified by scatter and co-expression of CD41 and CD150, and the percentage of platelets expressing EGFP determined. Representative plots are shown. (B) CD45.1/2 recipient mice were co-transplanted with 1 000 000 mir144/451EGFP/+ and 2 000 000 of either FOGCon or FOGcKO bone marrow cells. PB was analysed by flow cytometry 4 weeks after transplantation. Mice were then injected with poly(I-C). In all, 31 and 45 days after the first poly(I-C) injection (three injections, 2 day intervals), PB analysis was performed (only 45 day time point is shown). Erythrocytes were identified by scatter and expression of Ter119, and the percentage of erythrocytes expressing EGFP determined. Representative plots are shown. (C) Summary of data obtained in (A), showing the percentage of EGFP+ and EGFP– platelets before and after poly(I-C) injection. FOGCon: N=7; FOGcKO: N=7. Error bars show standard deviations. Asterisks indicate statistical significance (***P<0.001; Student's t-test). (D) Summary of data obtained in (B), showing the percentage of EGFP+ and EGFP– erythrocytes before and after poly(I-C) injection. FOGCon: N=4; FOGcKO: N=5. Error bars show standard deviations. Asterisks indicate statistical significance (****P<0.0001; Student's t-test).
Figure 7
Figure 7
Loss of FOG-1 prevents extinction of the GM program in preMegE cells. (A, B) Quantitative RT–PCR on sorted bone marrow preMegE isolated from FOG1Con and FOG1cKO competitive-transplanted mice. Data show average mRNA expression normalized to Hprt1 from three independently transplanted mice, each mouse assayed in triplicate. (C) Gene set enrichment analysis comparing FOG1cKO and FOG1Con preMegEs and (D) LSKFlt3 cells. Panels show enrichment of preMegE (top)- and preGM (bottom)-specific gene sets in the FOG1cKO genotype relative to FOG1Con. The normalized enrichment score (NES), nominal P-value and false discovery rate (FDR) are indicated on each plot. (E) Gene set enrichment analysis comparing CebpaKK and wild-type (WT) control LSK cells. Panels show enrichment of preMegE (top)- and preGM (bottom)-specific gene sets in the CebpaKK genotype relative to wild type. The NES, nominal P-value and FDR are indicated on each plot. (F) Lineage potential of FOG1Con and FOG1cKO PreMegEs, assayed as in Figure 1D. Error bars show standard deviations. Asterisks indicate statistical significance (*P<0.05; **P<0.01; ***P<0.001; Student's t-test). (G) Expression of Trib2 in progenitor subsets based on Affymetrix array analysis of CLP (n=3), preGM (n=3) and preMegE populations (n=5). Expression values are normalized to Hprt expression. Error bars indicate standard deviations. Asterisks indicate statistical significance (***P<0.001; Student's t-test). (H) Expression of Trib2 in control and FOG-1-deficient preMegEs based on real-time Q–PCR (Con: N=3; cKO; N=3) and Affymetrix analysis (Con: N=3; cKO; N=3). Asterisks indicate statistical significance (*P<0.05; ***P<0.001; Student's t-test). (I) Trib2 promoter region, showing the position of the amplicons surrounding putative GATA/FOG binding sites, identified by sequence analysis. Arrow indicates the transcriptional start site; open box 5′ non-coding part of exon 1; closed box coding sequence. (J) ChIP was performed on sorted preMegEs (50 000 cells/IP), using anti-GATA-2, anti-FOG-1 and control IgG antibodies, followed by PCR amplification of Trib2 and control Csn2 amplicons. Values are expressed as enrichment (antibody/IgG ratio) relative to the enrichment observed for the Csn2 amplicon. Each value is the average of triplicate determinations.
Figure 8
Figure 8
Lineage perturbations in FOG-1- and C/EBP-deficient haematopoiesis. (A) The myelo-erythroid lineage bifurcation in normal haematopoiesis. (B) In FOG-1-deficient haematopoiesis, phenotypic preMegEs upregulate Cebpa and Cebpb, assume preGM-like gene expression and give rise to myeloid cells, but no committed Mk or E progenitors or colonies. (C) Conversely, C/EBP-deficient preGM cells are blocked in the progression to the GMP stage, upregulate Zfpm1 (encoding FOG-1) and Mk-specific genes, and show ectopic Mk potential.

Similar articles

Cited by

References

    1. Adolfsson J, Mansson R, Buza-Vidas N, Hultquist A, Liuba K, Jensen CT, Bryder D, Yang L, Borge OJ, Thoren LA, Anderson K, Sitnicka E, Sasaki Y, Sigvardsson M, Jacobsen SE (2005) Identification of Flt3+ lympho-myeloid stem cells lacking erythro-megakaryocytic potential a revised road map for adult blood lineage commitment. Cell 121: 295–306 - PubMed
    1. Akashi K, Traver D, Miyamoto T, Weissman IL (2000) A clonogenic common myeloid progenitor that gives rise to all myeloid lineages. Nature 404: 193–197 - PubMed
    1. Amigo JD, Ackermann GE, Cope JJ, Yu M, Cooney JD, Ma D, Langer NB, Shafizadeh E, Shaw GC, Horsely W, Trede NS, Davidson AJ, Barut BA, Zhou Y, Wojiski SA, Traver D, Moran TB, Kourkoulis G, Hsu K, Kanki JP et al. (2009) The role and regulation of friend of GATA-1 (FOG-1) during blood development in the zebrafish. Blood 114: 4654–4663 - PMC - PubMed
    1. Athanasiou M, Clausen PA, Mavrothalassitis GJ, Zhang XK, Watson DK, Blair DG (1996) Increased expression of the ETS-related transcription factor FLI-1/ERGB correlates with and can induce the megakaryocytic phenotype. Cell growth Differ 7: 1525–1534 - PubMed
    1. Athanasiou M, Mavrothalassitis G, Sun-Hoffman L, Blair DG (2000) FLI-1 is a suppressor of erythroid differentiation in human hematopoietic cells. Leukemia 14: 439–445 - PubMed

Publication types

MeSH terms