. 2011 Nov 15;108(46):E1128-36.
doi: 10.1073/pnas.1110574108. Epub 2011 Nov 7.

Copy number variation detection in whole-genome sequencing data using the Bayesian information criterion

Affiliations

Copy number variation detection in whole-genome sequencing data using the Bayesian information criterion

Ruibin Xi et al. Proc Natl Acad Sci U S A. .

Abstract

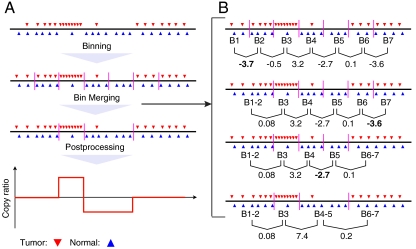
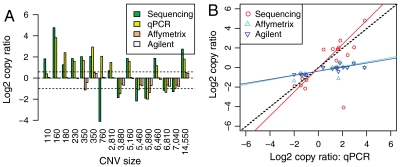
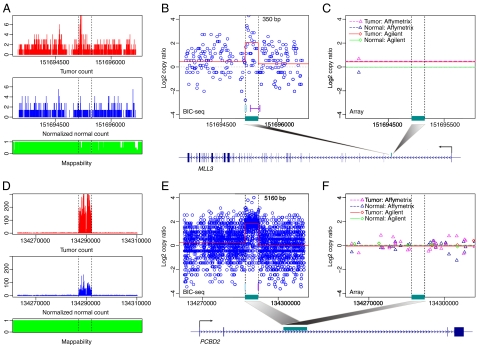
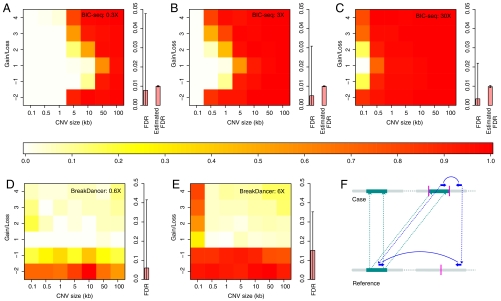
DNA copy number variations (CNVs) play an important role in the pathogenesis and progression of cancer and confer susceptibility to a variety of human disorders. Array comparative genomic hybridization has been used widely to identify CNVs genome wide, but the next-generation sequencing technology provides an opportunity to characterize CNVs genome wide with unprecedented resolution. In this study, we developed an algorithm to detect CNVs from whole-genome sequencing data and applied it to a newly sequenced glioblastoma genome with a matched control. This read-depth algorithm, called BIC-seq, can accurately and efficiently identify CNVs via minimizing the Bayesian information criterion. Using BIC-seq, we identified hundreds of CNVs as small as 40 bp in the cancer genome sequenced at 10× coverage, whereas we could only detect large CNVs (> 15 kb) in the array comparative genomic hybridization profiles for the same genome. Eighty percent (14/16) of the small variants tested (110 bp to 14 kb) were experimentally validated by quantitative PCR, demonstrating high sensitivity and true positive rate of the algorithm. We also extended the algorithm to detect recurrent CNVs in multiple samples as well as deriving error bars for breakpoints using a Gibbs sampling approach. We propose this statistical approach as a principled yet practical and efficient method to estimate CNVs in whole-genome sequencing data.


Conflict of interest statement

The authors declare no conflict of interest.

Figures

Fig. 1.
Fig. 1.
A schema for BIC-seq. (A) The dataflow of BIC-seq. First, the short reads are aligned to the reference genome and the outliers are removed. Then, the short reads are binned into small bins (e.g., 10 bp bins), and the initial bins are iteratively merged using the BIC. The vertical purple bars in the plot are the boundaries between neighboring bins. Lastly, copy ratios are calculated based on the segmentation given by BIC-seq. (B) A bin-merging procedure based on the BIC. We demonstrate the procedure for λ = 1. Given a list of initial bins, BIC-seq first calculates the BIC differences between the current configuration and all possible configurations in which two adjacent bins are merged. In the plot, the numbers under the bin pairs are their corresponding BIC differences. Then, BIC-seq identifies the pair with the smallest BIC difference. If this BIC difference is less than zero, the corresponding bin pair will be merged; otherwise, BIC-seq will stop merging bin pairs. In this example, the bin pair B1 and B2 have the smallest BIC difference (-3.7) and they are merged, giving a new bin B1-2. BIC-seq then updates the BIC differences for the bin pairs. As shown in the plot, we only need to update the BIC difference for the bin pair B1-2 and B3, because all other BIC differences remain the same as before the merging of B1 and B2. This fact holds in general and we used it to expedite BIC-seq (SI Appendix). The above process is then repeated until the BIC cannot be improved further—i.e., until no BIC difference is less than zero. After the merging of bin pairs, BIC-seq also tries to merge three or more neighboring bins if their merging can improve the BIC (SI Appendix). For this example, the merging of three or more neighboring bins cannot improve the BIC.
Fig. 2.
Fig. 2.
CNVs detected by BIC-seq in the GBM genome. (A and B) The distribution of putative CNVs detected in GBM with tuning parameter λ = 2 and 4, respectively. Here, the x axis notes the CNV sizes. (C and D) Overlaps of GBM CNVs with Refseq genes for λ = 2 and λ = 4. Intergenic, no overlap with any gene; whole gene, covering an entire gene; exon, overlapping with at least one exon but not covering an entire gene; Intron, overlapping with introns but not exons.
Fig. 3.
Fig. 3.
Experimental validation of 16 BIC-seq CNVs. (A) Bar plot of the log2 copy ratios estimated from the four platforms. The two dashed lines correspond to copy ratios 1.5 and 0.5, respectively. (B) Scatter plot of the log2 copy ratios given by the sequencing data and two array-based platforms versus the log2 copy ratios given by qPCR. The red, cyan, and blue solid lines are the fitted linear median regression models using the log2 copy ratios given by qPCR as a predictor and the log2 copy ratios given by sequencing data and two array-based platforms as responses, respectively. The slopes of the linear model for sequencing, Affymetrix, and Agilent are 1.21 (SD 0.20), 0.23 (SD 0.06), and 0.21 (SD 0.05), showing that copy ratios given by sequencing data are more accurate than that given by array platforms.
Fig. 4.
Fig. 4.
Two qPCR validated CNVs that were missed by the array-based platforms. (AC) A 350-bp focal CNV. (A) The distribution of tumor (Top) and normal (Bottom) reads near the identified CNV at nucleotide resolution. The normal reads are rescaled such that the summation of the transformed values is the same as the total tumor read count. (B) The local profile given by BIC-seq (red line). The circles are the copy ratios calculated based on 10-bp bins. The regions marked by cyan and purple lines are the 95% credible intervals for the left and right breakpoints of the CNV. The CNV overlaps with the intronic region of the gene MLL3 and the position of the CNV in the gene is marked by the dark cyan bar. (C) The profiles given by Affimetrix and Agilent platforms. (DF) Another validated CNV missed by the array platforms. The CNV overlapped with the gene PCBD2. Both tumor and normal genomes are enriched in this CNV region, but the enrichment magnitude of the tumor genome is even greater than its matched normal genome.
Fig. 5.
Fig. 5.
Statistical power for CNV detection. The colors represent the power of CNV detection under different scenarios, with red regions indicating the greatest power. The y axis denotes the number of copies gained or lost. (AC) The CNV detection power of BIC-seq at 0.3×, 3×, and 30× coverage, respectively. The bar plot on the right shows the mean FDR of the 100 simulations and the corresponding mean estimated FDR. Here, 0.3× coverage means that both tumor and normal sequencing are 0.3× and similarly for the others. The bars in the box plot are the error bars of the true and the estimated FDRs (2 SD around the mean with lower bound of zero). (D and E) The SV detection power of BreakDancer at 0.6× and 6× coverage. Because BreakDancer only uses sequencing data from the tumor genome, we doubled the sequencing reads to make the comparison fair (Materials and Methods). (F) The signature of a PEM resulting from a duplication that would be misleading. A DNA segment (the dark cyan segment in the reference genome and the left dark cyan segment in the case genome) is duplicated and inserted to another position on the same chromosome (the dark cyan segment on the right part of the case genome). The purple bar in the plot represents the breakpoint of the insertion. A paired-end read (the blue arrows) that spans the breakpoint in the case genome is sequenced. When the pair is mapped back to the reference genome, the mapped distance between the two ends is significantly larger than the insert size, which is similar to a paired-end read resulting from a large deletion in the case genome.
Fig. P1.
Fig. P1.
A qPCR-validated CNV (350 bp) that was missed by the array-based platforms. (A) The local profile given by BIC-seq (red line). The circles are the copy ratios calculated based on 10-bp bins. The regions marked by cyan and purple lines are the 95% credible intervals for the left and right breakpoints of the CNV. The CNV overlaps with the intronic region of the gene MLL3 and the position of the CNV in the gene is marked by the dark cyan bar. (B) The profiles given by Affimetrix and Agilent platforms.

Similar articles

Cited by

  • Distinct Classes of Complex Structural Variation Uncovered across Thousands of Cancer Genome Graphs.
    Hadi K, Yao X, Behr JM, Deshpande A, Xanthopoulakis C, Tian H, Kudman S, Rosiene J, Darmofal M, DeRose J, Mortensen R, Adney EM, Shaiber A, Gajic Z, Sigouros M, Eng K, Wala JA, Wrzeszczyński KO, Arora K, Shah M, Emde AK, Felice V, Frank MO, Darnell RB, Ghandi M, Huang F, Dewhurst S, Maciejowski J, de Lange T, Setton J, Riaz N, Reis-Filho JS, Powell S, Knowles DA, Reznik E, Mishra B, Beroukhim R, Zody MC, Robine N, Oman KM, Sanchez CA, Kuhner MK, Smith LP, Galipeau PC, Paulson TG, Reid BJ, Li X, Wilkes D, Sboner A, Mosquera JM, Elemento O, Imielinski M. Hadi K, et al. Cell. 2020 Oct 1;183(1):197-210.e32. doi: 10.1016/j.cell.2020.08.006. Cell. 2020. PMID: 33007263 Free PMC article.
  • A genetic model for neurodevelopmental disease.
    Coe BP, Girirajan S, Eichler EE. Coe BP, et al. Curr Opin Neurobiol. 2012 Oct;22(5):829-36. doi: 10.1016/j.conb.2012.04.007. Epub 2012 May 2. Curr Opin Neurobiol. 2012. PMID: 22560351 Free PMC article. Review.
  • Preprocessing Sequence Coverage Data for More Precise Detection of Copy Number Variations.
    Zare F, Ansari S, Najarian K, Nabavi S. Zare F, et al. IEEE/ACM Trans Comput Biol Bioinform. 2020 May-Jun;17(3):868-876. doi: 10.1109/TCBB.2018.2869738. Epub 2018 Sep 12. IEEE/ACM Trans Comput Biol Bioinform. 2020. PMID: 30222580 Free PMC article.
  • Molecular dissection of colorectal cancer in pre-clinical models identifies biomarkers predicting sensitivity to EGFR inhibitors.
    Schütte M, Risch T, Abdavi-Azar N, Boehnke K, Schumacher D, Keil M, Yildiriman R, Jandrasits C, Borodina T, Amstislavskiy V, Worth CL, Schweiger C, Liebs S, Lange M, Warnatz HJ, Butcher LM, Barrett JE, Sultan M, Wierling C, Golob-Schwarzl N, Lax S, Uranitsch S, Becker M, Welte Y, Regan JL, Silvestrov M, Kehler I, Fusi A, Kessler T, Herwig R, Landegren U, Wienke D, Nilsson M, Velasco JA, Garin-Chesa P, Reinhard C, Beck S, Schäfer R, Regenbrecht CR, Henderson D, Lange B, Haybaeck J, Keilholz U, Hoffmann J, Lehrach H, Yaspo ML. Schütte M, et al. Nat Commun. 2017 Feb 10;8:14262. doi: 10.1038/ncomms14262. Nat Commun. 2017. PMID: 28186126 Free PMC article.
  • NGSCheckMate: software for validating sample identity in next-generation sequencing studies within and across data types.
    Lee S, Lee S, Ouellette S, Park WY, Lee EA, Park PJ. Lee S, et al. Nucleic Acids Res. 2017 Jun 20;45(11):e103. doi: 10.1093/nar/gkx193. Nucleic Acids Res. 2017. PMID: 28369524 Free PMC article.

References

    1. Fanciulli M, et al. FCGR3B copy number variation is associated with susceptibility to systemic, but not organ-specific, autoimmunity. Nat Genet. 2007;39:721–723. - PMC - PubMed
    1. Sebat J, et al. Strong association of de novo copy number mutations with autism. Science. 2007;316:445–449. - PMC - PubMed
    1. Stone J, et al. Rare chromosomal deletions and duplications increase risk of schizophrenia. Nature. 2008;455:237–241. - PMC - PubMed
    1. Stefansson H, et al. Large recurrent microdeletions associated with schizophrenia. Nature. 2008;455:232–236. - PMC - PubMed
    1. Walters R, et al. A new highly penetrant form of obesity due to deletions on chromosome 16p11. Nature. 2010;463:671–675. - PMC - PubMed

Publication types

LinkOut - more resources