. 2012 Feb;60(2):175-88.
doi: 10.1002/glia.21249. Epub 2011 Nov 2.

Neuronal activity regulates glutamate transporter dynamics in developing astrocytes

Affiliations

Neuronal activity regulates glutamate transporter dynamics in developing astrocytes

Adrienne M Benediktsson et al. Glia. 2012 Feb.

Abstract

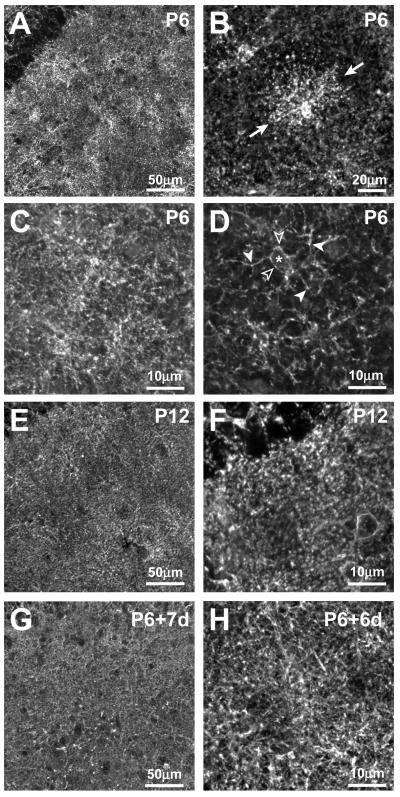
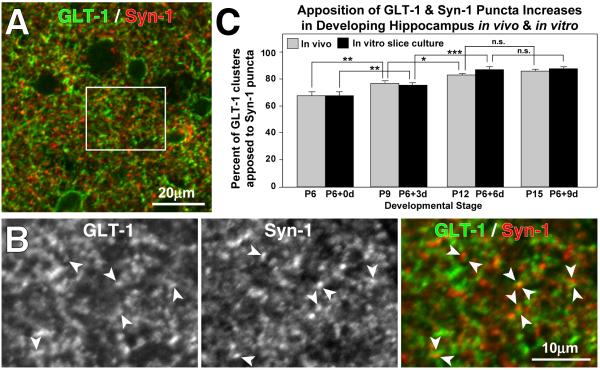
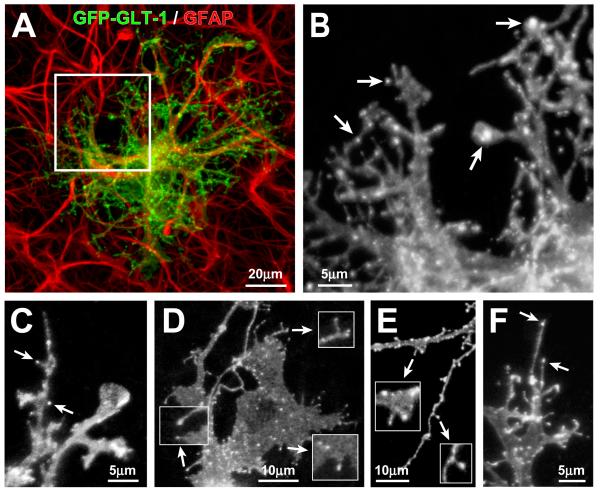
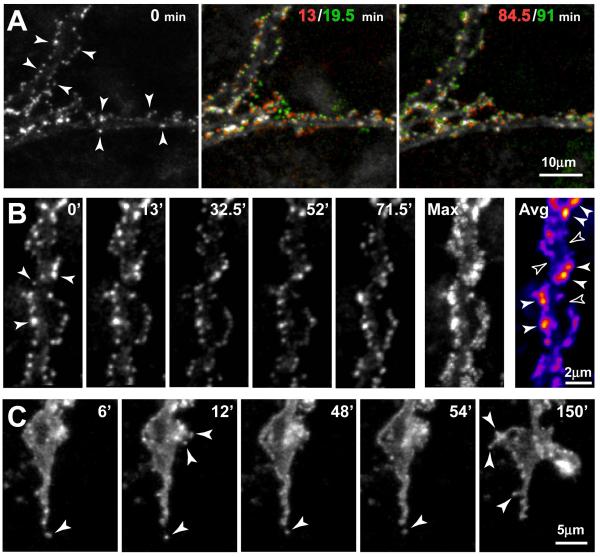
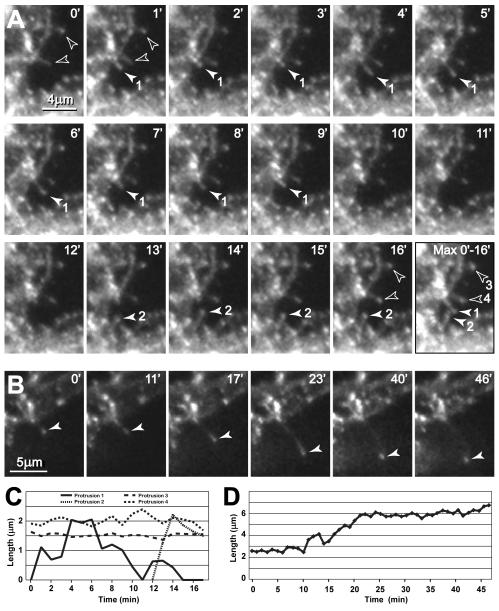
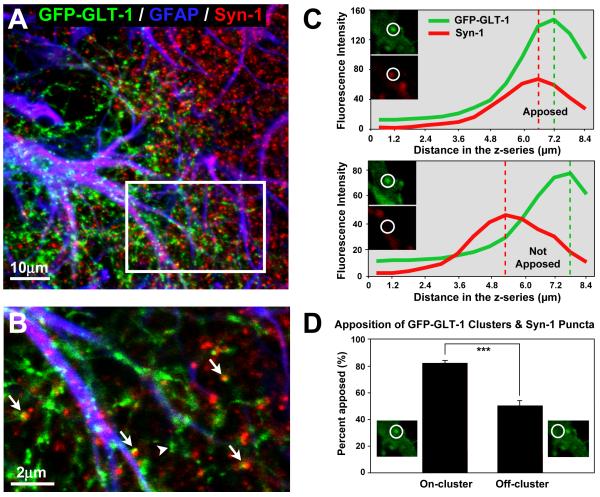
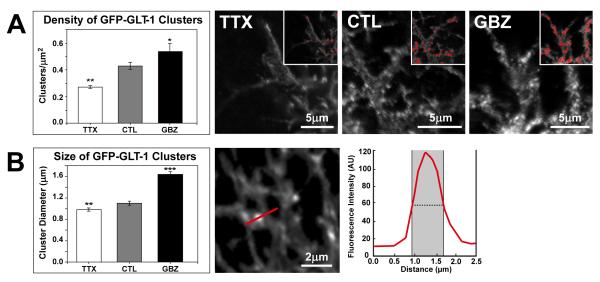
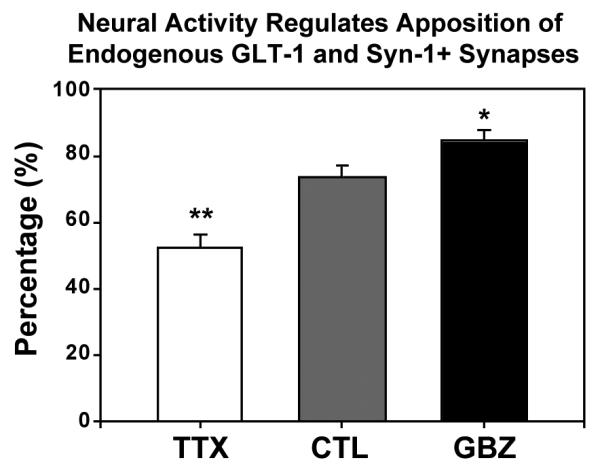
Glutamate transporters (GluTs) maintain a low ambient level of glutamate in the central nervous system (CNS) and shape the activation of glutamate receptors at synapses. Nevertheless, the mechanisms that regulate the trafficking and localization of transporters near sites of glutamate release are poorly understood. Here, we examined the subcellular distribution and dynamic remodeling of the predominant GluT GLT-1 (excitatory amino acid transporter 2, EAAT2) in developing hippocampal astrocytes. Immunolabeling revealed that endogenous GLT-1 is concentrated into discrete clusters along branches of developing astrocytes that were apposed preferentially to synapsin-1 positive synapses. Green fluorescent protein (GFP)-GLT-1 fusion proteins expressed in astrocytes also formed distinct clusters that lined the edges of astrocyte processes, as well as the tips of filopodia and spine-like structures. Time-lapse three-dimensional confocal imaging in tissue slices revealed that GFP-GLT-1 clusters were dynamically remodeled on a timescale of minutes. Some transporter clusters moved within developing astrocyte branches as filopodia extended and retracted, while others maintained stable positions at the tips of spine-like structures. Blockade of neuronal activity with tetrodotoxin reduced both the density and perisynaptic localization of GLT-1 clusters. Conversely, enhancement of neuronal activity increased the size of GLT-1 clusters and their proximity to synapses. Together, these findings indicate that neuronal activity influences both the organization of GluTs in developing astrocyte membranes and their position relative to synapses.


Figures

Figure 1
Figure 1. Anti-GLT-1 antibodies show punctate immunostaining in developing hippocampal area CA1
(A-D) GLT-1 immunoreactivity (IR) in hippocampal area CA1 from P6 rat. (A) Low magnification view of a P6 tissue slice shows non-uniform staining. (B) In some tissues, distinct astrocyte-like “patches” (arrows) are evident above a lower level, more dispersed pattern of punctate staining. A ‘projection image’ of a confocal image stack (C) and a single confocal image plane (D) of the same field of view demonstrate that GLT-1 patches correspond to IR cells whose cell body (* and open arrowheads) and processes (solid arrowheads) are diffusely labeled and bear small, intensely fluorescent puncta (D). (E, F) Low (E) and high (F) magnification views of a P12 hippocampal slice showing more uniform punctate distribution of GLT-1. Astrocyte-like patches of GLT-1 IR are less prominent at P12. (G, H) Representative low- (G) and high- (H) magnification views of P6 hippocampal slices cultured for 6-7 days in vitro show a GLT-1 distribution similar to that in P12 in vivo.
Figure 2
Figure 2. GLT-1 clusters increasingly localize near synapses as development proceeds
(A) Low magnification, single confocal image plane view of P9 hippocampal tissue double-labeled for GLT-1 (green) and synapsin-1 (red). (B) Boxed region from ‘A’ showing instances of apposition or overlap of syn-1 and GLT-1 (arrowheads). (C) Quantitative analyses show that the developmental increase in apposition of GLT-1 and syn-1 immunopuncta is similar in tissues acutely isolated from P6 thru P15 rat and in organotypic slice cultures isolated from P6 rat and cultured for 3, 6, or 9 d in vitro. Values shown are mean ± S.D and are based on analysis of at least 300 puncta from a minimum of five separate fields of view for each condition. * p<0.05; ** p<0.02; *** p<0.002. n.s = not significant.
Figure 3
Figure 3. GFP-GLT-1 in transfected astrocytes in slice cultures is concentrated in clusters within lamellae, spine-like, and filopodia-like processes
(A) Low magnification view of a CA1 hippocampal astrocyte in a P6 + 5 days in vitro (DIV) slice culture expressing GFP-GLT-1 (green) and immunostained for GFAP (red). (B) Higher magnification view showing intensely fluorescent GFP-GLT-1 clusters (arrows) against a lower level of diffuse fluorescence in astrocytic processes. (C-F) Examples of GFP-GLT-1 clusters in short, spine-like structures (C-E, arrows) and at the tips of longer filopodia-like structures (F, arrows). Numerous GFP-GLT-1 clusters are distributed over the surface of sheet-like lamellipodia (D) and line the edges of astrocyte processes (E).
Figure 4
Figure 4. Time-lapse imaging shows remodeling of GFP-GLT-1 clusters in developing astrocytes in situ
(A) Left image shows portions of two processes near the margin of a GFP-GLT-1-expressing astrocyte (P6 + 6 DIV slice culture). Note the GFP-GLT-1 clusters (arrowheads) positioned along the edges of the processes. Color composite images (center and right) show changes in cluster position in pairs of time-points (encoded red and green, respectively), 6.5 min apart, near the beginning (13/19.5 min) and end (84.5/91 min) of a ~90 min imaging session. Clusters that do not change position between time-points appear white. Note that many GFP-GLT-1 clusters move within the 6 minute intervals, although some are stable. Image in panels A and B are z-stack projections of nine focal planes. (B) Representative images from a time-lapse sequence shows remodeling of GFP-GLT-1 clusters in the top astrocyte process in panel A. Note that clusters of differing sizes line the edges of the processes (arrowheads at 0 min). Although most clusters change position slightly from frame to frame, many individual clusters can be followed over the ~90 min sequence. The ‘Max’ image is a maximum brightness composite showing the peak intensities across all 16 time points in the sequence, thereby representing the area sampled by the clusters in this astrocyte branch over a 90 min period of time. The ‘Ave’ image shows average intensity at each position over the time sequence, with a pseudo-color look-up table applied to indicate regions showing greater average GLT-1 cluster occupancy. These ‘cumulative time’ images show areas of high (solid arrowheads) and low cluster occupancy (open arrowheads) along single astrocyte branches. See supplemental video. (C) Remodeling of GFP-GLT-1 clusters at the growing tip of a developing astrocyte branch that undergoes cycles of extension and retraction. Short, spine-like structures on growing astrocyte branches extend and retract, carrying along GFP-GLT-1 clusters. A GFP-GLT-1 cluster retracts along with a thin filopodium at the tip of the branch (bottom arrowhead, 6-54 min). Meanwhile, some small spine-like structures containing GFP-GLT-1 clusters extend from another region of the astrocyte process (upper arrowheads, 12 min). Later, three spine-like structures extend (arrowheads, 150 min) and persist for the remainder of the time-lapse sequence (total time = 4.45 hr). See supplemental video.
Figure 5
Figure 5. Remodeling of GLT-1 clusters associated with lateral filopodia on developing astrocytes
(A) High-magnification, time-lapse sequence of a region at the margin of a GFP-GLT-1 expressing astrocyte shows remodeling of four filopodia and spine-like protrusions (numbered 1 to 4 in the ‘Max’ projection image) over a 16 min period of time (confocal stacks of images taken every 1 min). Some protrusions transiently extend and retract (solid arrowheads; 1, 2), while others persist and do not change (open arrowheads; 3, 4). Each protrusion reaches a peak length of ~2 μm. The last panel is a maximum brightness composite of all time-points showing the area sampled by the protrusions during a 16 min period. See supplementary video. (B) Different region of the same cell shows a persistent protrusion that elongates from ~2 μm to over 6 μm long within a 15 min period of time, carrying along a GFP-GLT-1 cluster at its tip as it grows. See supplementary video. (C, D) Graphs of protrusion length for the structures shown in panels A and B, respectively.
Figure 6
Figure 6. GFP-GLT-1 clusters often adjoin synapsin-1-positive presynaptic terminals
(A) Low-magnification, three-channel merged image of a region of an astrocyte transfected with GFP-GLT-1 (green) and, after 48 hr, fixed and immunostained for GFAP (blue) and synapsin-1 (syn-1, red). The image represents a projection of 10 z-plane optical sections spanning ~8μm. (B) Single confocal image plane from boxed region in (A) showing close apposition or overlap (yellow) of GFP-GLT-1 clusters and anti-syn-1 immunopuncta (arrows). Some GFP-GLT-1 clusters do not adjoin synapsin-I puncta (arrowhead). (C) Analysis of apposition of GFP-GLT-1 clusters and syn-1 puncta. Upper panel: A 2 μm diameter region-of-interest (ROI) is centered on a GFP-GLT-1 cluster and an adjoining syn-1 immunopunctum in a single confocal image plane. The plot of mean fluorescence intensity along the z-axis for the ROI shows that the green and red channel intensity peaks are within 1 μm of each other, thereby meeting our criteria for apposition. Lower panel: A 2 μm diameter ROI is centered on a GFP-GLT-1 cluster that does not adjoin a syn-1 immunopunctum. In this instance, the peak fluorescence intensity of a syn-1 punctum in the red channel is not within 1 μm of the peak intensity of the green channel, and thus is not considered apposed. (D) Sites on transfected astrocytes that contain GFP-GLT-1 clusters are much more frequently localized near syn-1 immunopuncta than sites that do not contain GLT-1 clusters (off-cluster, randomized control). These data indicate a preferential localization of GFP-GLT-1 clusters near synaptic structures. ***=p < 0.001.
Figure 7
Figure 7. Synaptic transmission regulates the size and density of GFP-GLT-1 clusters
(A) As synaptic transmission increases, there is a corresponding increase in the density of GFP-GLT-1 clusters, from 0.27 clusters/μm2 in the activity blockade (TTX) condition, to 0.43 clusters/μm2 in control (CTL) condition, and 0.54 clusters/μm2 in GBZ treated slices. Portions of transfected astrocytes under TTX, CTL, or GBZ conditions are shown at right. Insets show suprathreshold regions (red) that were considered clusters for the quantitative analysis (see Methods for details). (B) The mean diameter of individual GFP-GLT-1 clusters increases as synaptic activity increases. Cluster diameter was defined as the full width at half maximum fluorescent intensity (shaded region in graph) along a line bisecting the cluster. Student’s T-test. *=p < 0.05, **=p < 0.01, ***=p < 0.001.
Figure 8
Figure 8. Synaptic transmission regulates synaptic apposition of endogenous GLT-1
Graph shows percentage of GLT-1 immunopuncta apposed to syn-1 immunopuncta in TTX, control, and GBZ conditions in slice cultures. TTX significantly decreased apposition of GLT-1 immunopuncta (n= 262) with synapses, whereas GBZ treatment significantly increased the apposition of GLT-1 puncta (n=174) with synapses. Student’s T-test. * = p < 0.05, ** = p < 0.01.

Similar articles

Cited by

References

    1. Alvarez VA, Sabatini BL. Anatomical and physiological plasticity of dendritic spines. Annu Rev Neurosci. 2007;30:79–97. - PubMed
    1. Benediktsson AM, Schachtele SJ, Green SH, Dailey ME. Ballistic labeling and dynamic imaging of astrocytes in organotypic hippocampal slice cultures. J Neurosci Methods. 2005;141:41–53. - PubMed
    1. Bergles DE, Jahr CE. Synaptic activation of glutamate transporters in hippocampal astrocytes. Neuron. 1997;19:1297–1308. - PubMed
    1. Buchs P-A, Stoppini L, Muller D. Structural modifications associated with synaptic development in area CA1 of rat hippocampal organotypic cultures. Dev. Brain Res. 1993;71:81–91. - PubMed
    1. Bushong EA, Martone ME, Ellisman MH. Maturation of astrocyte morphology and the establishment of astrocyte domains during postnatal hippocampal development. Int J Dev Neurosci. 2004;22:73–86. - PubMed

Publication types

Substances