. 2011 Nov 2:6:75.
doi: 10.1186/1750-1326-6-75.

Generation and characterization of transgenic mice expressing mitochondrial targeted red fluorescent protein selectively in neurons: modeling mitochondriopathy in excitotoxicity and amyotrophic lateral sclerosis

Affiliations

Generation and characterization of transgenic mice expressing mitochondrial targeted red fluorescent protein selectively in neurons: modeling mitochondriopathy in excitotoxicity and amyotrophic lateral sclerosis

Yi Wang et al. Mol Neurodegener. .

Abstract

Background: Mitochondria have roles or appear to have roles in the pathogenesis of several chronic age-related and acute neurological disorders, including Charcot-Marie-Tooth disease, amyotrophic lateral sclerosis, Parkinson's disease, and cerebral ischemia, and could be critical targets for development of rational mechanism-based, disease-modifying therapeutics for treating these disorders effectively. A deeper understanding of neural tissue mitochondria pathobiologies as definitive mediators of neural injury, disease, and cell death merits further study, and the development of additional tools to study neural mitochondria will help achieve this unmet need.

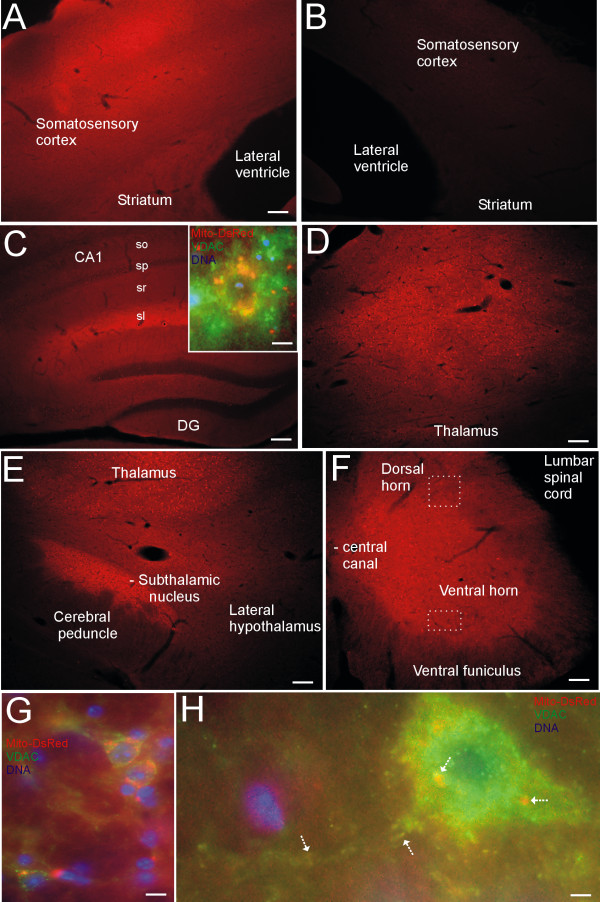
Results: We created transgenic mice that express the coral (Discosoma sp.) red fluorescent protein DsRed2 specifically in mitochondria of neurons using a construct engineered with a Thy1 promoter, specific for neuron expression, to drive expression of a fusion protein of DsRed2 with a mitochondrial targeting sequence. The biochemical and histological characterization of these mice shows the expression of mitochondrial-targeted DsRed2 to be specific for mitochondria and concentrated in distinct CNS regions, including cerebral cortex, hippocampus, thalamus, brainstem, and spinal cord. Red fluorescent mitochondria were visualized in cerebral cortical and hippocampal pyramidal neurons, ventrobasal thalamic neurons, subthalamic neurons, and spinal motor neurons. For the purpose of proof of principle application, these mice were used in excitotoxicity paradigms and double transgenic mice were generated by crossing Thy1-mitoDsRed2 mice with transgenic mice expressing enhanced-GFP (eGFP) under the control of the Hlxb9 promoter that drives eGFP expression specifically in motor neurons and by crossing Thy1-mitoDsRed2 mice to amyotrophic lateral sclerosis (ALS) mice expressing human mutant superoxide dismutase-1.

Conclusions: These novel transgenic mice will be a useful tool for better understanding the biology of mitochondria in mouse and cellular models of human neurological disorders as exemplified by the mitochondrial swelling and fission seen in excitotoxicity and mouse ALS.


Figures

Figure 1
Figure 1
Design of Thy1-mitoDsRed construct used to generate tg mice. A tg construct containing the entire open reading frame of the DsRed2 gene (red) fused in frame with the mitochondrial targeting sequence of the human cytochrome c oxidase subunit VIII gene (orange) was cloned into the Thy1.2 expression cassette at the XhoI site by T4 ligation.
Figure 2
Figure 2
Visualization of mitochondria in living cultured neurons using mitochondrial-targeted DsRed2. A. Embryonic mouse primary cerebral cortical neuron transfected with mitoDsRed plasmid. The cell body (lower left) containing numerous mitochondria is overexposed to show individual mitochondria in fine distal processes (arrows). Scale bar = 7 μm. B. NSC34 motor neuron-like cells transfected with mitoDsRed plasmid showing vast numbers of mitochondria forming a network in the cytoplasm surrounding the nucleus (asterisk). Scale bar = 6 μm. C. Mouse cerebral cortical astrocytes expressing mitochondrial-targeted DsRed show mitochondria as long vermiform, ellipsoid, or round organelles. Asterisks identify nucleus. Scale bar = 6 μm. D. NSC34-motor neuron transfected with Thy1-mitoDsRed plasmid. Cell body fluorescence is bright due to numerous mitochondria and overexposure, while individual mitochondria in a long dendrite (arrow) can be discerned. Scale bar = 6 μm. E-G. Embryonic mouse primary spinal cord neuron transfected with Thy1-mitoDsRed plasmid and shown at different exposures to reveal red fluorescent mitochondria in the cell body (E, asterisk marks the nucleus) and distal processes (F and G, arrows). Scale bar = 6 μm. H and I. NMDA receptor activation by quinolinic acid causes mitochondrial pathology as seen directly in living cultured primary cortical neurons by Thy1-mitoDsRed. Mouse cortical neurons treated with PBS (vehicle) show numerous individual mitochondria distributed throughout the dendritic arborization (H, arrows). Neurons treated with 100 μM quinolinic acid undergo mitochondrial swelling (arrows) and dendrite retraction by 4 hours (I). Scale bars = 6 μm. Images are representative of at least 3 different cell culture experiments.
Figure 3
Figure 3
Thy1-mitoDsRed2 tg mouse generation and characterization. A. Genomic identification of tg mice. Thy1-mitoDsRed tg mice showed a PCR-amplified 208 bp product that was undetected in non-tg mice. B. Western blot analysis of subcellular fractions of Thy1-mitoDsRed tg mouse brain and spinal cord demonstrating the presence of DsRed protein in mitochondrial-enriched fractions but not in soluble protein fractions. Purified recombinant DsRed was loaded as a positive control. Blots were reprobed with antibody to cofilin to show protein loading. Results were replicated using several tg mice (n = 8). C. Western blot analysis showing the tissue distributions and brain regional distributions of DsRed protein expression in Thy1-mitoDsRed tg mice. Crude extracts were used. DsRed protein was detected at varying levels of expression in most CNS regions but not in liver or kidney (4 of 5 lines). Recombinant DsRed was loaded as a positive control. The nitrocellulose membrane was stained with Ponceau S to show protein loading. Results were replicated using several tg mice (n = 8). D. RT-PCR analysis showing the tissue distributions of DsRed mRNA expression in Thy1-mitoDsRed tg mice. DsRed mRNA was detected in brain but not in skeletal muscle, heart, liver, or kidney. VDAC1 mRNA was used as an internal control. Results were replicated using several tg mice (n = 5). E. RT-PCR analysis showing brain regional distributions of DsRed mRNA expression in Thy1-mitoDsRed tg mice. DsRed protein was detected at varying levels of expression in several different CNS regions. VDAC1 mRNA was an internal control. Results were replicated using several tg mice (n = 5).
Figure 4
Figure 4
Mitochondrial visualization in Thy1-mitoDsRed2 tg mouse CNS. A. Tg mice showed DsRed fluorescence in somatosensory cortex with varying intensities in different cortical layers. Scale bar = 70 μm (same for B). B. Non-tg mice have no red fluorescence in somatosensory cortex. C. Tg mice showed DsRed fluorescence in hippocampus. All layers of CA1 were fluorescent, including stratum oriens (so), stratum pyramidale (sp), stratum radiatum (sr), and stratum lacunosum-moleculare (sl), with the sl showing the highest intensity; the dentate gyrus (DG) showed lower DsRed fluorescence compared to CA1. The granule cell layer of DG was nearly negative. Inset shows colocalization (orange-yellow) of DsRed fluorescence with VDAC (green) in a CA1 pyramidal neuron cell body. Nuclei are blue. Scale bars = 47 μm (inset, 4 μm). D. Tg mice showed DsRed fluorescence in ventrobasal complex of thalamus. Scale bar = 70 μm. E. Tg mice showed DsRed fluorescence in subthalamic nucleus, while nearby cerebral peduncle and lateral hypothalamus showed very low fluorescence. Scale bar = 70 μm. F. Spinal cord gray matter showed DsRed fluorescence in tg mice. White hatched boxes in dorsal horn and ventral delineate regions shown at higher magnification in G and H. Scale bar = 100 μm. G. Colocalization (orange-yellow) of DsRed fluorescence with VDAC (green) in dorsal horn neurons. Cell nuclei are blue. Scale bar = 5 μm. H. Colocalization (orange-yellow, arrows) of DsRed fluorescence with VDAC (green) in motor neuron. Scale bar = 3 μm. Images are representative of numerous tg (n = 20) or control (n = 10) mice.
Figure 5
Figure 5
Further characterization of the intracellular localization of DsRed in neurons Thy1-mitoDsRed2 tg mice. Immunofluorescent localization of catalase (A), LC3A (B) and cytochrome P450 reductase (C), as markers for peroxisomes/nucleus, autophagic vesicles and endoplasmic reticulum (ER), respectively, in brainstem sections shows mitochondrial-specific labeling with DsRed. Cell nuclei (blue) were visualized with the DNA stain Hoechst-33342 dye. A. Large brainstem neurons showing intracellular segregation of catalase immunoreactivity (green) and DsRed. Scale bar = 7 μm. B. Brainstem neurons showing partial overlap of cytoplasmic DsRed and LC3A (green) seen as yellow. Individual red and green signals are also seen. Scale bar = 5 μm. C. Brainstem locus ceruleus neurons (red, right) peri-cerulean neurons showing distinct DsRed and ER (green) intracellular localizations. Scale bar = 5 μm. Images are representative of several different tg mice (n = 8).
Figure 6
Figure 6
Thy1-mitoDsRed2 tg mice in studies of motor neurons. A. E13 tg Hb9-eGFP mouse embryo section showing motor neurons below the sulcus limitans (SL). Scale bar = 40 μm. B. Spinal cords of E13 Hb9-eGFP tg mouse embryos were subjected to flow cytometry and sorted by side scatter (SSC) and forward scatter (FSC) into small cells/debris and large cells (P1, blue and red dots). C. P1 (large) cells were subjected to FACS and sorted by viability based on phycoerythrin annexin (PE-A) negativity and eGFP (FITC)-positivity resulting in P2 cells. D. Cultured P2 cells were eGFP-positive motor neurons. Scale bar = 15 μm. E, F. Mitochondria (F, arrows) in living Hb9-eGFP motor neurons visualized by transfection with Thy1-mitoDsRed2 construct. Scale bar = 7 μm. G, H. Double tg mice expressing Hb9-eGFP and Thy1-mitoDsRed2 were created to image mitochondria (arrows) directly in living motor neurons. Scale bar = 7 μm. I, J. Mitochondrial visualization (hatched arrows) in situ in spinal cord motor neurons of Thy1-mitoDsRed tg mice (I) and tg ALS mice expressing human mutant SOD1 and Thy1-mitoDsRed (J). Asterisks mark nucleus. MitoDsRed reveals directly the mitochondrial swelling (J, hatched arrows) and fragmentation (J, open arrow) in ALS mouse motor neurons, and magnitude of mitochondrial swelling (K). Scale bars = 2 μm (I) and 2.5 μm (J). K. Mitochondrial diameters in motor neurons of Thy1-mitoDsRed2 tg mice (control) and SOD1-G93A:Thy1-mitoDsRed2 tg mice. Values are mean ± SD. Mitochondrial diameters in motor neurons were increased 5-fold (*, p < 0.01, n = 6 mice/group).
Figure 7
Figure 7
Application of Thy1-mitoDsRed tg mice in studies of kainic acid (KA) excitotoxicity-induced mitochondrial fission in spinal cord motor neurons. A. Mice with phosphate-buffered saline (PBS) injections placed stereotaxically in lumbar spinal cord had motor neurons with perikaryal (asterisk identifies the nucleus of individual neurons in all images in A-C) DsRed-tagged mitochondria having normal mostly uniform appearances and distributions. B. Mice with KA injections in lumbar spinal cord and 12-hour recovery had motor neurons with perikaryal DsRed-tagged mitochondria appearing heterogeneous in size with an apparent increase in small round mitochondria. C. Mice with KA injections in lumbar spinal cord and 24-hour recovery had motor neurons with perikaryal DsRed-tagged mitochondria appearing as swollen, clumped or aggregated. Scale bar (in A) = 5 μm (same for B and C). Images are representative of four different tg mice per group. D. Western blot for Drp1 in lumbar spinal cord extracts of Thy1-mitoDsRed tg mice after intraspinal injection of PBS or KA and survival for 12 or 24 hours. Actin is shown for protein loading.

Similar articles

Cited by

References

    1. Zuchner S, Meriyanova IV, Muglia M, Bissar-Tadmouri N, Rochelle J, Dadali EL, Zappia M, Nelis E, Patitucci A, Senderek J. et al.Mutation in the mitochondrial GTPase mitofusin 2 cause Charcot-Marie-Tooth neuropathy type 2A. Nat Gen. 2004;36:449–451. - PubMed
    1. Wallace DC. A mitochondrial paradigm of metabolic and degenerative diseases, aging, and cancer: a dawn of evolutionary medicine. Annu Rev Genet. 2005;39:359–407. - PMC - PubMed
    1. Su B, Wang X, Zheng L, Perry G, Smith MA, Zhu X. Abnormal mitochondrial dynamics and neurodegenerative diseases. Biochim Biophy Acta. 2010;1802:135–142. - PMC - PubMed
    1. Reddy PH, Beal MF. Amyloid beta, mitochondrial dysfunction and synaptic damage: implications for cognitive decline in aging and Alzheimer's disease. Trends Mol Med. 2008;14:45–53. - PMC - PubMed
    1. Smith MA, Perry G. Free radical damage, iron, and Alzheimer's disease. J Neurol Sci. 1995;134(Suppl):92–94. - PubMed

Publication types

MeSH terms