

Deep molecular characterization of HIV-1 dynamics under suppressive HAART
- PMID: 22046128
- PMCID: PMC3203183
- DOI: 10.1371/journal.ppat.1002314
Deep molecular characterization of HIV-1 dynamics under suppressive HAART
Abstract
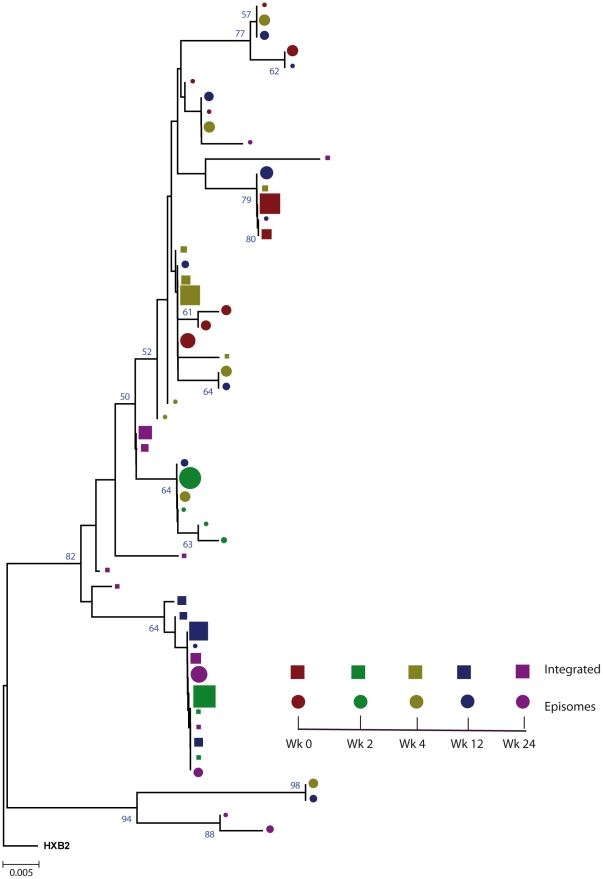
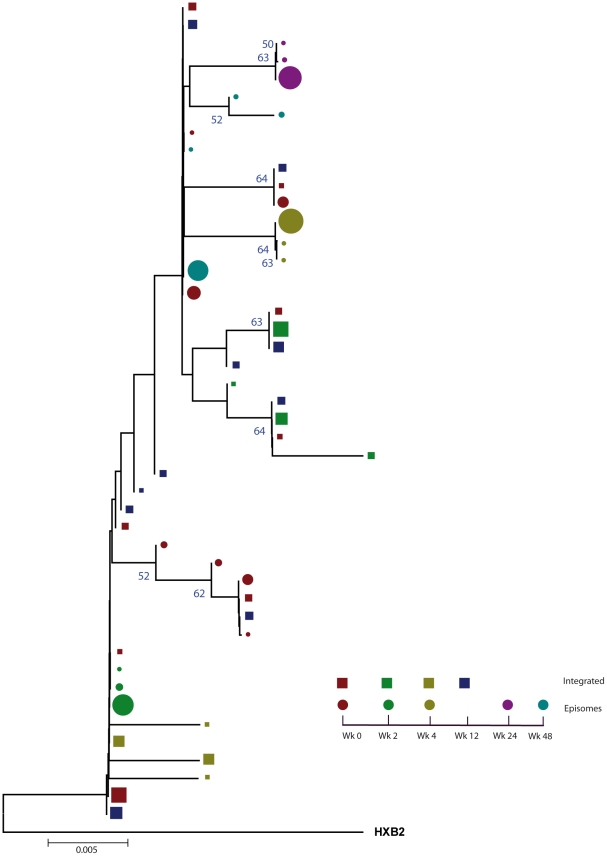
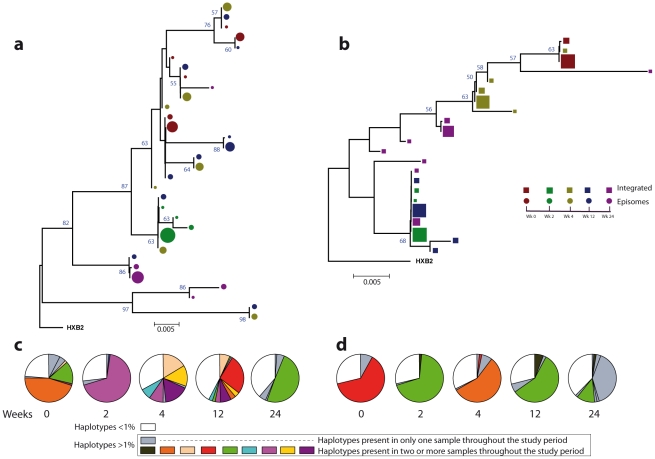
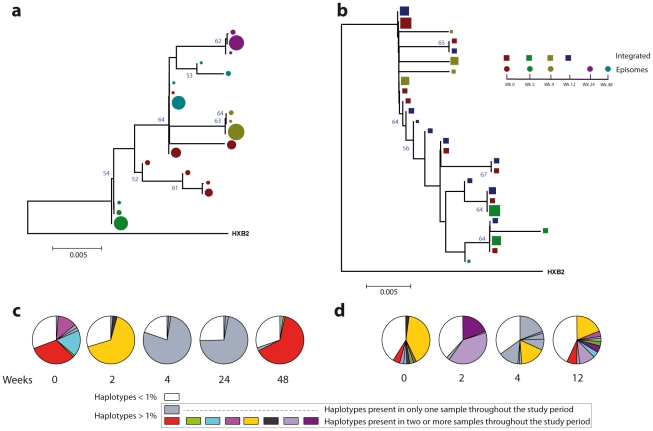
In order to design strategies for eradication of HIV-1 from infected individuals, detailed insight into the HIV-1 reservoirs that persist in patients on suppressive antiretroviral therapy (ART) is required. In this regard, most studies have focused on integrated (proviral) HIV-1 DNA forms in cells circulating in blood. However, the majority of proviral DNA is replication-defective and archival, and as such, has limited ability to reveal the dynamics of the viral population that persists in patients on suppressive ART. In contrast, extrachromosomal (episomal) viral DNA is labile and as a consequence is a better surrogate for recent infection events and is able to inform on the extent to which residual replication contributes to viral reservoir maintenance. To gain insight into the diversity and compartmentalization of HIV-1 under suppressive ART, we extensively analyzed longitudinal peripheral blood mononuclear cells (PBMC) samples by deep sequencing of episomal and integrated HIV-1 DNA from patients undergoing raltegravir intensification. Reverse-transcriptase genes selectively amplified from episomal and proviral HIV-1 DNA were analyzed by deep sequencing 0, 2, 4, 12, 24 and 48 weeks after raltegravir intensification. We used maximum likelihood phylogenies and statistical tests (AMOVA and Slatkin-Maddison (SM)) in order to determine molecular compartmentalization. We observed low molecular variance (mean variability ≤0.042). Although phylogenies showed that both DNA forms were intermingled within the phylogenetic tree, we found a statistically significant compartmentalization between episomal and proviral DNA samples (P<10(-6) AMOVA test; P = 0.001 SM test), suggesting that they belong to different viral populations. In addition, longitudinal analysis of episomal and proviral DNA by phylogeny and AMOVA showed signs of non-chronological temporal compartmentalization (all comparisons P<10(-6)) suggesting that episomal and proviral DNA forms originated from different anatomical compartments. Collectively, this suggests the presence of a chronic viral reservoir in which there is stochastic release of infectious virus and in which there are limited rounds of de novo infection. This could be explained by the existence of different reservoirs with unique pharmacological accessibility properties, which will require strategies that improve drug penetration/retention within these reservoirs in order to minimise maintenance of the viral reservoir by de novo infection.
Conflict of interest statement
The authors have declared that no competing interests exist.
Figures
Similar articles
-
HIV-1 replication and immune dynamics are affected by raltegravir intensification of HAART-suppressed subjects.Nat Med. 2010 Apr;16(4):460-5. doi: 10.1038/nm.2111. Epub 2010 Mar 14. Nat Med. 2010. PMID: 20228817
-
Episomal HIV-1 DNA and its relationship to other markers of HIV-1 persistence.Retrovirology. 2018 Jan 30;15(1):15. doi: 10.1186/s12977-018-0398-1. Retrovirology. 2018. PMID: 29378611 Free PMC article. Review.
-
Effect of raltegravir intensification on HIV proviral DNA in the blood and gut mucosa of men on long-term therapy: a randomized controlled trial.AIDS. 2012 Jan 14;26(2):167-74. doi: 10.1097/QAD.0b013e32834e8955. AIDS. 2012. PMID: 22089379 Clinical Trial.
-
HIV Proviral Burden, Genetic Diversity, and Dynamics in Viremic Controllers Who Subsequently Initiated Suppressive Antiretroviral Therapy.mBio. 2021 Dec 21;12(6):e0249021. doi: 10.1128/mBio.02490-21. Epub 2021 Nov 16. mBio. 2021. PMID: 34781741 Free PMC article.
-
[Potential of integrase inhibitors to deplete HIV reservoirs or prevent their replenishment].Enferm Infecc Microbiol Clin. 2008 Nov;26 Suppl 12:17-22. doi: 10.1016/s0213-005x(08)76568-6. Enferm Infecc Microbiol Clin. 2008. PMID: 19572421 Review. Spanish.
Cited by
-
Guiding the humoral response against HIV-1 toward a MPER adjacent region by immunization with a VLP-formulated antibody-selected envelope variant.PLoS One. 2018 Dec 19;13(12):e0208345. doi: 10.1371/journal.pone.0208345. eCollection 2018. PLoS One. 2018. PMID: 30566493 Free PMC article.
-
Persistence of Human Immunodeficiency Virus-1 Drug Resistance Mutations in Proviral Deoxyribonucleic Acid After Virologic Failure of Efavirenz-Containing Antiretroviral Regimens.Open Forum Infect Dis. 2019 Jan 16;6(3):ofz034. doi: 10.1093/ofid/ofz034. eCollection 2019 Mar. Open Forum Infect Dis. 2019. PMID: 30863788 Free PMC article.
-
The importance of monocytes and macrophages in HIV pathogenesis, treatment, and cure.AIDS. 2014 Sep 24;28(15):2175-87. doi: 10.1097/QAD.0000000000000408. AIDS. 2014. PMID: 25144219 Free PMC article. Review.
-
Cross-clade ultrasensitive PCR-based assays to measure HIV persistence in large-cohort studies.J Virol. 2014 Nov;88(21):12385-96. doi: 10.1128/JVI.00609-14. Epub 2014 Aug 13. J Virol. 2014. PMID: 25122785 Free PMC article.
-
The Genomic Signature of Population Reconnection Following Isolation: From Theory to HIV.G3 (Bethesda). 2015 Nov 6;6(1):107-20. doi: 10.1534/g3.115.024208. G3 (Bethesda). 2015. PMID: 26546308 Free PMC article.
References
-
- Kieffer TL, Finucane MM, Nettles RE, Quinn TC, Broman KW, et al. Genotypic analysis of HIV-1 drug resistance at the limit of detection: virus production without evolution in treated adults with undetectable HIV loads. J Infect Dis. 2004;189:1452–1465. - PubMed
Publication types
MeSH terms
Substances
LinkOut - more resources
Full Text Sources
Other Literature Sources
Medical
