. 2011 Oct 28;147(3):565-76.
doi: 10.1016/j.cell.2011.08.050.

Master transcription factors determine cell-type-specific responses to TGF-β signaling

Affiliations

Master transcription factors determine cell-type-specific responses to TGF-β signaling

Alan C Mullen et al. Cell. .

Abstract

Transforming growth factor beta (TGF-β) signaling, mediated through the transcription factors Smad2 and Smad3 (Smad2/3), directs different responses in different cell types. Here we report that Smad3 co-occupies the genome with cell-type-specific master transcription factors. Thus, Smad3 occupies the genome with Oct4 in embryonic stem cells (ESCs), Myod1 in myotubes, and PU.1 in pro-B cells. We find that these master transcription factors are required for Smad3 occupancy and that TGF-β signaling largely affects the genes bound by the master transcription factors. Furthermore, we show that induction of Myod1 in nonmuscle cells is sufficient to redirect Smad3 to Myod1 sites. We conclude that cell-type-specific master transcription factors determine the genes bound by Smad2/3 and are thus responsible for orchestrating the cell-type-specific effects of TGF-β signaling.


Figures

Figure 1
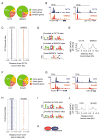
Figure 1. SMAD3 and OCT4 co-occupy the genome in ES cells
(A) Distribution of genes bound by OCT4 (left) and SMAD3 (right) across active, silent and bivalent genes in hES cells (Table S3). In all experiments, hES cells were grown in mTESR1 media, which contains TGF-β. Refer to Extended Experimental Procedures for details of hES cell culture and gene assignments. (B) SMAD3 and OCT4 co-occupy DNA sites in hES cells. Gene tracks represent binding of OCT4 (blue) and SMAD3 (red) at POU5F1, the gene encoding OCT4 (left) and LEFTY1 (right). The x-axis represents the linear sequence of genomic DNA and the y-axis represents the total number of mapped reads with the floor set at 2 counts unless specified otherwise. The genomic scale in kilobases (kb) is indicated above each track. (C) SMAD3 and OCT4 co-occupy the genome. Binding plots show the location of OCT4- (left) and SMAD3- (right) bound sites relative to 7,532 OCT4-bound sites. For each OCT4-bound site (y-axis) the presence of OCT4 (blue) and SMAD3 (red) sites are displayed within a 5 kb window centered on the OCT4-bound site. Intensity at position 0 indicates that sites overlap. (D) SMAD3 binding sites are enriched for the OCT4 motif. The most enriched motifs at OCT4-bound sites (top) and SMAD3-bound sites (center) were identified using MEME (Bailey and Elkan, 1994) (Fig S1). The canonical Smad Transfac motif (Smad binding element) (Matys et al., 2003) is shown. (E) The Smad binding element (SBE) is enriched at both OCT4- and SMAD3-bound sites. The histogram shows the average occurrence of the canonical SBE in a 250 bp window (y-axis) relative to the distance from the peak (x-axis) of OCT4- (left) or SMAD3-bound sites (right). (F) Distribution of genes bound by Oct4 (left) and Smad3 (right) across active, silent and bivalent genes in mES cells. All mES cells analyzed in Fig 1 were grown for 2 passages off feeders without addition of exogenous Activin or TGF-β (see Extended Experimental Procedures). The TGF-β signaling pathway is active under these standard mES cell culture conditions (Fig S1C). (G) Oct4 and Smad3 co-occupy DNA sites in mES cells. Gene tracks represent binding of Oct4 (blue) and Smad3 (red) at Pou5f1 (left) and at Lefty1 (right). (H) Smad3 and Oct4 co-occupy the genome. For each of the 15,003 Oct4-bound sites (y-axis) the presence of Oct4 (blue) and Smad3 (red) are displayed within a 5 kb window centered on each Oct4-bound site. (I) Smad3 binding sites are enriched for the Oct4 motif. Motif discovery was performed using the murine Oct4 and Smad3-bound sites. (J) The SBE is enriched at both Oct4 and Smad3-bound sites. The histogram of canonical SBE frequency (y-axis) was generated as described in E using murine Oct4 (left) and Smad3 sites (right). (K) Smad3 (Sm3) and Oct4 co-occupy the genome in ES cells by binding nearby DNA sites. The binding motif for each factor is displayed. See also Figure S1, Table S1–S2.
Figure 2
Figure 2. Smad3 co-occupies the genome with the ES cell core master transcription factors
(A) Gene tracks represent binding of Oct4, Sox2, Nanog (Marson et al., 2008), Smad3, Ronin (Dejosez et al., 2010), Zfx and c-Myc (Chen et al., 2008) at Max. Gray shading highlights co-occupied sites. (B) Smad3 and the core master transcription factors co-occupy the genome. The distribution of Smad3-bound sites (red) is shown relative to all bound sites for the indicated transcription factors (y-axis) in a 5 kb window centered on the bound sites for each transcription factor. ChIP-seq performed using an antibody against Smad2/3 showed similar results to Smad3 (Fig S2 B–D). (C) Smad3 co-occupies the genome with specific transcription factors. The percentage of Smad3 sites (y-axis) co-occupied by each transcription factor (x-axis) is shown. Co-occupancy is defined as greater than or equal to one base pair overlap between sites occupied by each factor. The 1000 strongest Smad3 binding sites were used for this analysis. (D) Ronin, Zfx, and c-Myc binding is not associated with Smad3. The distance from the center of each Smad3 site to the center of the nearest site bound by the indicated transcription factor was determined. These distances were grouped into bins (x-axis). The sum of bound sites in each bin is shown (y-axis). See also Figure S2.
Figure 3
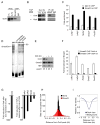
Figure 3. Oct4 recruits Smad3
(A) Smad3 and Oct4 are part of the same complex. ChIP was performed for Smad3 and IgG in mES cells followed by Western to detect Oct4. Whole cell extract (WCE) was used as a loading control. mES cells were grown under standard culture conditions unless otherwise specified. (B) pSmad3 interacts with Oct4, and this interaction is dependent on TGF-β signaling. mES cells were grown without (−) or with (+) SB431542 (TGF inhib) for 24 hr. Co-IPs with antibodies against pSmad3 and IgG were performed on nuclear lysates. Precipitated complexes were probed for Oct4. (C) Smad3 and Oct4 bind DNA sites at the same time. Oct4 ChIP was performed followed by re-ChIP using antibodies against Smad3 and IgG. qPCR was performed in triplicate to quantify the fold enrichment (y-axis) of Smad3 and IgG at the indicated genes (x-axis) relative to an unbound control region. Error bars indicate standard deviation. (D) Smad3 and Oct4 simultaneously occupy the Lefty1 enhancer. A 40 bp probe from the Lefty1 enhancer was incubated with nuclear extracts from mES cells (left lane). Nuclear extracts and probe were also incubated with cold competitor, antibody against Smad3 or antibody against Oct4. The complex formed by Smad3 and Oct4 (Smad/Oct) is supershifted (SS) by both antibodies. mES cells were cultured with SB431542 for 24 hr and then washed to remove inhibitor before treating with Activin for 1 hr to activate TGF-β signaling. (E) Smad3 levels are not affected by loss of Oct4. ZHBTc4 mES cells were cultured in the absence or presence of dox for 24 hr. Western blot was performed to quantify levels of Smad3 and Oct4. 25μg and 5μg of cell lysates were loaded. TATA binding protein (TBP) was used as a loading control. (F) Oct4 is required for Smad3 binding. ChIP was performed for Smad3 in ZHBTc4 mES cells without dox (Smad3 ChIP Oct4 nl) and with dox for 24 hr (Smad3 ChIP Oct4 kd). qPCR was performed to quantify the fold enrichment of Smad3 (y-axis) at the indicated genes (x-axis). Fold enrichment was normalized to IgG. (G) Oct4 is required for genes to respond to TGF-β signaling. ZHBTc4 mES cells were cultured without or with dox for 24 hr. Cells were then washed and treated with Activin for 1 hr prior to analysis of gene expression by qPCR. The fold reduction of Oct4 expression after 24 hr of dox (left) and the fold reduction in TGF-β response for genes co-occupied by Oct4 and Smad3 (right) are shown. (H) Oct4 sites are more tightly associated with Sox2 than Smad3. The distances from the Oct4 peak to the peaks of Sox2 (black) and Smad3 (red) were calculated for each region bound by Oct4, Sox2 and Smad3 (1849 regions). The distances between peaks were organized into 5-base pair bins, and the number of peaks in each bin (y-axis) is shown over a 0.6 kb window (x-axis) centered on the Oct4 peak at position 0. The distance between Oct4 and Sox2 sites is defined as positive. (I) Oct4 sites are depleted of nucleosomes. ChIP-seq was performed to map genome-wide H3 occupancy. The relative H3 density (y-axis) is shown across a 2kb window (x-axis) centered on sites occupied by Oct4.
Figure 4
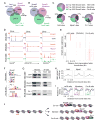
Figure 4. Smad3 co-occupies DNA with cell-type-specific master transcription factors
(A) Master transcription factors bind unique sites in different cell types. The Venn diagram shows the overlap of sites bound by Oct4 in mES cells (blue), Myod1 in myotubes (purple) and PU.1 in pro-B cells (green) (Table S1). The total number of bound sites is indicated for each shaded area. 3% of all sites overlap in at least two cell types (indicated by dotted lines). (B) Smad3 binds unique sites in different cell types. The Venn diagram shows the overlap of Smad3-bound regions between mES cells (blue), myotubes (purple) and pro-B cells (green). 1% of Smad3-bound sites overlap in at least two cell types. Myotubes and Pro-B cells were treated with TGF-β prior to analysis of Smad3 binding. (C) Smad3 co-occupies sites with master transcription factors that are cell-type specific. The 1000 strongest Smad3 binding sites (by peak height) were chosen from each cell type for analysis (top left). The co-occupancy of Oct4 (bottom left), Myod1 (bottom center) and PU.1 (bottom right) with Smad3 in each cell type is shown. (D) Smad3 co-occupies cell-type-specific sites with master transcription factors at individual genes. Gene tracks represent binding of Smad3 and Oct4 in mES cells (top), Smad3 and Myod1 in myotubes (center) and Smad3 and PU.1 in pro-B cells (bottom) for the genes encoding Sox2, Adora1 and Vpreb2. The floor is set at 3 counts. See also Figure S3. (E) Smad3 co-occupies the genome with cell-type-specific master transcription factors. Binding plots show the location of Smad3-bound sites in mES cells (left), myotubes (center) and pro-B cells (right) relative to sites bound by Oct4 in mES cells (top), Myod1 in myotubes (middle) and PU.1 in pro-B cells (bottom). (F) Smad3 binding sites are enriched for the motif of the cell-type-specific master transcription factor. Motif discovery was performed using Myod1 and Smad3-bound sites identified in myotubes (top) and PU.1 and Smad3-bound sites in pro-B cells (bottom). The most enriched motifs are shown. (G) Smad3 interacts with master transcription factors. Co-IPs with antibodies against Smad3 (Sm3) and IgG were performed using nuclear lysates from mES cells (top), myotubes (center), and pro-B cells (bottom). Precipitated complexes were probed for Oct4 in mES cells, Myod1 in myotubes and PU.1 in pro-B cells. Smad4 was used as a positive control for immunoprecipitation. (H) SBEs are enriched at sites occupied by master transcription factors. The average frequency of SBEs in a 250 bp window across a 5kb region centered on the binding site of each transcription factor is indicated. (I) Nucleosomes are depleted at sites co-occupied by Smad3 and master transcription factors. Relative H3 density centered on sites co-occupied by Oct4 and Smad3 (O+S) in mES cells (left), Myod1 and Smad3 (M+S) in myotubes (center) and PU.1 and Smad3 (P+S) in pro-B cells (right) is shown. (J) Model for cell-type specific genome occupancy by Smad3. Cell-type specific Smad3 binding may be determined by interactions with master transcription factors, which occupy nucleosome-depleted regions and recruit Smad3 to cell-type-specific sites. Red boxes indicate SBEs and gray cylinders represent nucleosomes.
Figure 5
Figure 5. Smad3 can bind the same gene at different sites in different cell types
(A) Smad3 binds a small number of genes in common between different cell types. The Venn diagram shows the overlap of genes bound by Smad3 in mES cells, myotubes and pro-B cells (Table S3). The numbers represent the total number of bound genes in each shaded area. (B) Smad3 co-occupies the same gene but at cell-type-specific sites. Gene tracks show binding of Smad3 and Oct4 in mES cells (top), Smad3 and Myod1 in myotubes (center) and Smad3 and PU.1 in pro-B cells (bottom) for Id3, Arid3a and Pmepa1. Gray boxes highlight sites co-occupied by Smad3 and master transcription factors in each cell type. The floor is set at 3 counts. (C) Smad3 co-occupies a fraction of genes with different master transcription factors by binding at different sites. At hypothetical Gene A one SBE (red box) is adjacent to an Oct4 site and another is adjacent to a PU.1 site. In mES cells Smad3 (Sm3) binds with Oct4 while in pro-B cells Smad3 binds with PU.1. See also Table S3.
Figure 6
Figure 6. TGF-β signaling regulates genes bound by master transcription factors
(A) Schematic of analysis. Genes affected by loss of TGF-β signaling were identified by genome-wide microarray analysis. Next, the overlap of genes affected by TGF-β signaling and genes bound by each transcription factor (TF) were determined. The p-value was calculated using the hypogeometric distribution. (B) Inhibition of the TGF-β pathway affects genes bound by the mES cell core regulatory transcription factors. Genome-wide expression was performed in mES cells that were cultured under standard conditions or in the presence of SB431542 for 24 hr. The association of genes bound by each transcription factor with genes affected by TGF-β signaling (significance of transcription factor occupancy at genes affected by TGF-β signaling, x-axis) was calculated for genes bound by Oct4, Sox2, Nanog, Smad3 and Zfx (y-axis). A factor was considered to bind genes affected by TGF-β signaling at a p value < 1e-5 (gray line). (C) TGF-β signaling leads to recruitment of p300 at genes co-occupied by Oct4 and Smad3. mES cells were treated with SB431542 for 24 hr before being washed and treated with fresh SB431542 or 10 ng/ml Activin for 1 hr. ChIP was performed for p300 and IgG, and qPCR was performed to quantify the fold enrichment of p300 relative to IgG (y-axis) at the indicated genes. (D) TGF-β signaling regulates different genes in different cell types. Genome-wide expression analysis was performed after 24 hr treatment with SB431542 in mES cells and 12 hr after activation of TGF-β signaling in myotubes and pro-B cells. The fold change in expression for each affected gene is indicated by color (bottom) and is shown for mES cells (left), myotubes (center) and pro-B cells (right). All genes that change in only one cell type are shown. Statistical analysis was then performed (as described in A) to determine if there was an association between genes bound by each transcription factor and genes affected by TGF-β signaling for each cell type. Analysis was performed for genes affected by TGF-β signaling in mES cells (top right), myotubes (middle right) and pro-B cells (bottom right). See also Table S4.
Figure 7
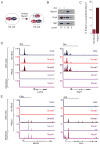
Figure 7. Myod1 expression redirects Smad3 occupancy in mES cells
(A) Experimental model. Smad3 co-occupies the genome with Oct4 in mES cells. Myod1 expression was induced in mES cells for 5 days in standard mES cell culture conditions. ChIP-seq was performed to determine if Smad3 was directed to new sites occupied by Myod1. (B) Oct4 expression is maintained despite induction of Myod1. mES cells containing dox-repressible Myod1 (Nishiyama et al., 2009) were cultured in standard mES cell conditions for 5 days with and without dox. Western analysis was performed to detect expression of Myod1 (top) and Oct4 (middle). TBP was used as a loading control (bottom). (C) Smad3 occupies new sites with Myod1. The percentage of Smad3 sites in mES cells that are also occupied by Myod1 in myotubes (y-axis) is shown for mES cells without induction of Myod1 (No Myod1) and with induction of Myod1 (+Myod1). The 1000 strongest Smad3 binding sites in each condition were used for this calculation. (D) Smad3 continues to occupy sites bound by Oct4. Gene tracks show binding of Oct4, Smad3 without induction of Myod1 (red), Smad3 with induction of Myod1 (brown) and Myod1 (after induction) in mES cells at Lefty2 and Tdgf1. Myod1 binding in myotubes is shown at the bottom. The floor is set at 3 counts. (E). Smad3 occupies new sites bound by Myod1. Gene tracks show binding of Oct4, Smad3 without induction of Myod1 (red), Smad3 with induction of Myod1 (brown) and Myod1 (after induction) in mES cells at the muscle specific genes Mef2d and Ckm. Myod1 binding in myotubes is shown at the bottom.

Similar articles

Cited by

References

    1. Bailey TL, Elkan C. Fitting a mixture model by expectation maximization to discover motifs in biopolymers. Proc Int Conf Intell Syst Mol Biol. 1994;2:28–36. - PubMed
    1. Beattie GM, Lopez AD, Bucay N, Hinton A, Firpo MT, King CC, Hayek A. Activin A maintains pluripotency of human embryonic stem cells in the absence of feeder layers. Stem Cells. 2005;23:489–495. - PubMed
    1. Boyer LA, Lee TI, Cole MF, Johnstone SE, Levine SS, Zucker JP, Guenther MG, Kumar RM, Murray HL, Jenner RG, et al. Core transcriptional regulatory circuitry in human embryonic stem cells. Cell. 2005;122:947–956. - PMC - PubMed
    1. Chambers I, Smith A. Self-renewal of teratocarcinoma and embryonic stem cells. Oncogene. 2004;23:7150–7160. - PubMed
    1. Chen CR, Kang Y, Siegel PM, Massague J. E2F4/5 and p107 as Smad cofactors linking the TGFbeta receptor to c-myc repression. Cell. 2002;110:19–32. - PubMed

Publication types

Associated data