

Formation of B-1 B cells from neonatal B-1 transitional cells exhibits NF-κB redundancy
- PMID: 22031760
- PMCID: PMC3221773
- DOI: 10.4049/jimmunol.1102416
Formation of B-1 B cells from neonatal B-1 transitional cells exhibits NF-κB redundancy
Abstract
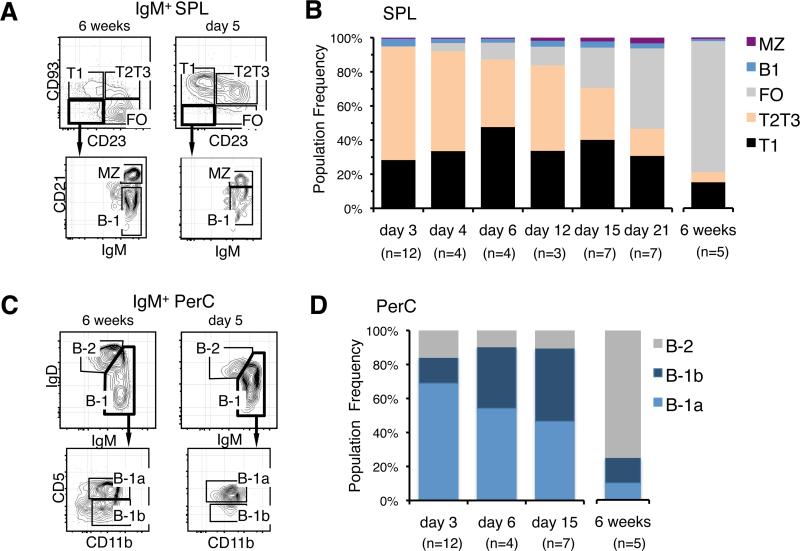
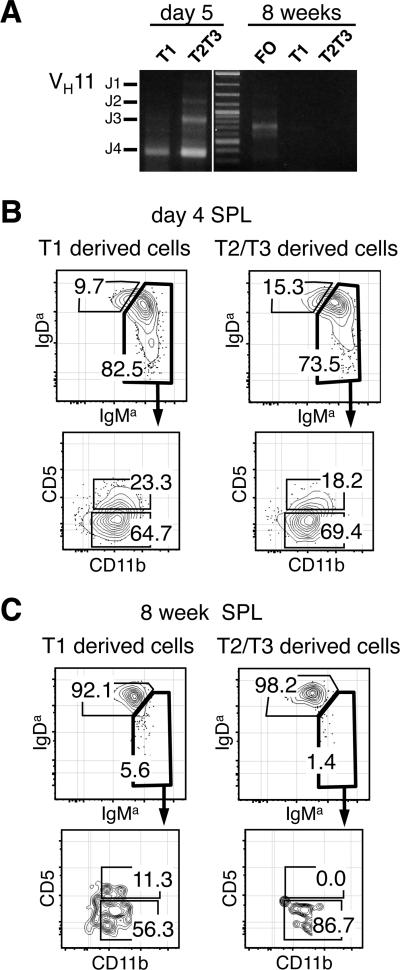
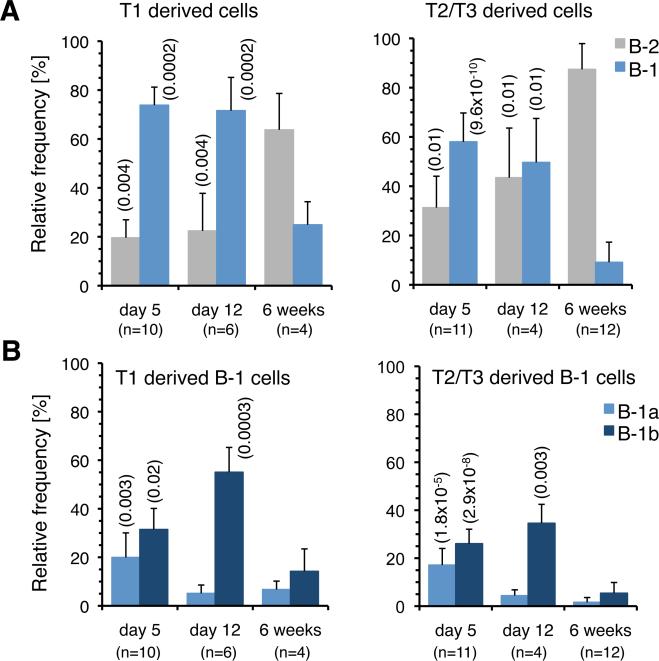
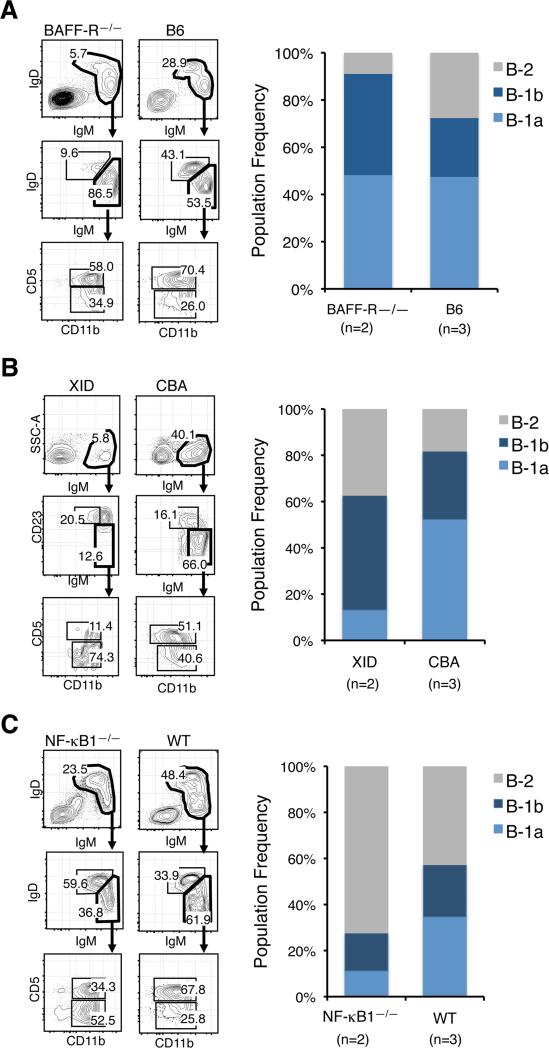
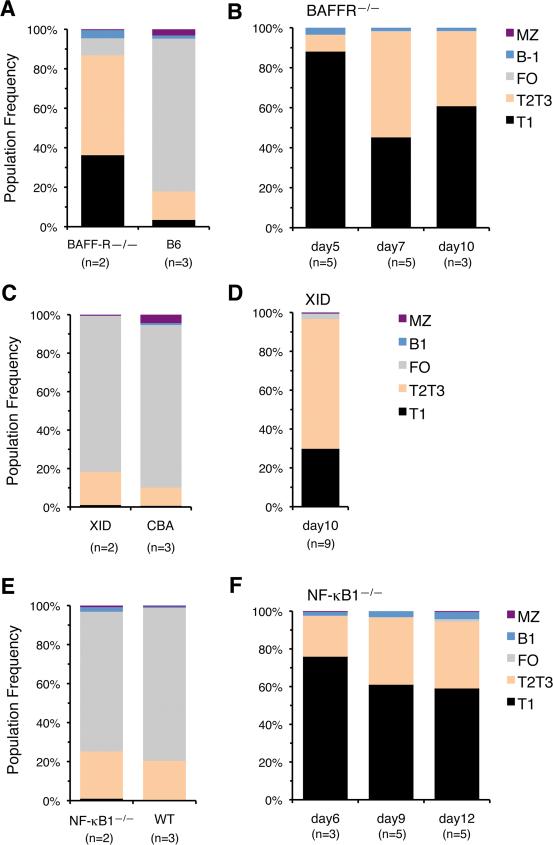
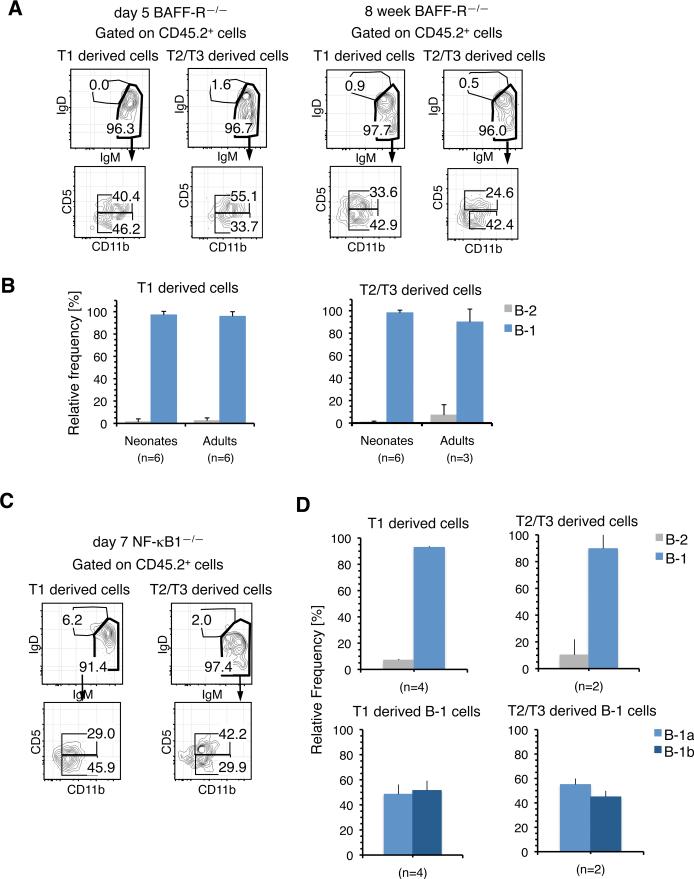
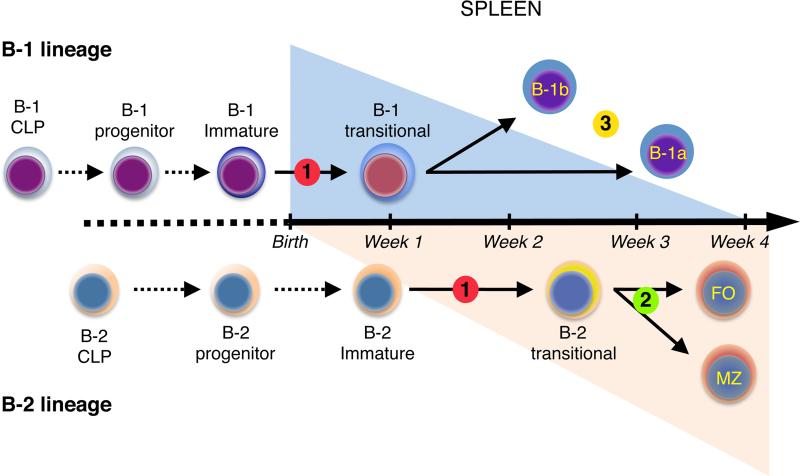
The stages of development leading up to the formation of mature B-1 cells have not been identified. As a result, there is no basis for understanding why various genetic defects, and those in the classical or alternative NF-κB pathways in particular, differentially affect the B-1 and B-2 B cell lineages. In this article, we demonstrate that B-1 B cells are generated from transitional cell intermediates that emerge in a distinct neonatal wave of development that is sustained for ~2 wk after birth and then declines as B-2 transitional cells predominate. We further show that, in contrast to the dependence of B-2 transitional cells on the alternative pathway, the survival of neonatal B-1 transitional cells and their maturation into B-1 B cells occurs as long as either alternative or classical NF-κB signaling is intact. On the basis of these results, we have generated a model of B-1 development that allows the defects in B-1 and B-2 cell production observed in various NF-κB-deficient strains of mice to be placed into a coherent cellular context.
Figures
Similar articles
-
Cell-autonomous role for NF-kappa B in immature bone marrow B cells.J Immunol. 2009 Mar 15;182(6):3406-13. doi: 10.4049/jimmunol.0803360. J Immunol. 2009. PMID: 19265118 Free PMC article.
-
Contrasting responses of lymphoid progenitors to canonical and noncanonical Wnt signals.J Immunol. 2008 Sep 15;181(6):3955-64. doi: 10.4049/jimmunol.181.6.3955. J Immunol. 2008. PMID: 18768850 Free PMC article.
-
B lymphocyte development in rabbit: progenitor B cells and waning of B lymphopoiesis.J Immunol. 2003 Dec 15;171(12):6372-80. doi: 10.4049/jimmunol.171.12.6372. J Immunol. 2003. PMID: 14662835
-
Plugging the leaky pre-B cell receptor.J Immunol. 2010 Feb 1;184(3):1127-9. doi: 10.4049/jimmunol.0990113. J Immunol. 2010. PMID: 20089707 Review. No abstract available.
-
Fetal B-cell lymphopoiesis and the emergence of B-1-cell potential.Nat Rev Immunol. 2007 Mar;7(3):213-9. doi: 10.1038/nri2019. Nat Rev Immunol. 2007. PMID: 17318232 Review.
Cited by
-
Roles for BLyS family members in meeting the distinct homeostatic demands of innate and adaptive B cells.Front Immunol. 2013 Feb 25;4:37. doi: 10.3389/fimmu.2013.00037. eCollection 2013. Front Immunol. 2013. PMID: 23443938 Free PMC article.
-
Expression of plasma cell alloantigen 1 defines layered development of B-1a B-cell subsets with distinct innate-like functions.Proc Natl Acad Sci U S A. 2012 Dec 4;109(49):20077-82. doi: 10.1073/pnas.1212428109. Epub 2012 Nov 19. Proc Natl Acad Sci U S A. 2012. PMID: 23169635 Free PMC article.
-
Neonatal Immune Responses to Respiratory Viruses.Front Immunol. 2022 Apr 14;13:863149. doi: 10.3389/fimmu.2022.863149. eCollection 2022. Front Immunol. 2022. PMID: 35493465 Free PMC article. Review.
-
Antibodies in action: the role of humoral immunity in the fight against atherosclerosis.Immun Ageing. 2022 Dec 2;19(1):59. doi: 10.1186/s12979-022-00316-6. Immun Ageing. 2022. PMID: 36461105 Free PMC article. Review.
-
B-1a lymphocytes promote oligodendrogenesis during brain development.Nat Neurosci. 2018 Apr;21(4):506-516. doi: 10.1038/s41593-018-0106-4. Epub 2018 Mar 5. Nat Neurosci. 2018. PMID: 29507409
References
-
- Chung J, Sillverman M, Monroe J. Transitional B cells: step by step towards immune competence. Trends Immunol. 2003;24:343–349. - PubMed
-
- Carsetti R, Rosado MM, Wardmann H. Peripheral development of B cells in mouse and man. Immunol. Rev. 2004;197:179–191. - PubMed
-
- Thomas M, Srivastava B, Allman D. Regulation of peripheral B cell maturation. Cell Immunol. 2006;239:92–102. - PubMed
-
- Martin F, Kearney JF. Marginal-zone B cells. Nat. Rev. Immunol. 2002;2:323–335. - PubMed
Publication types
MeSH terms
Substances
Grants and funding
LinkOut - more resources
Full Text Sources
Research Materials