. 2011 Dec 16;286(50):43437-46.
doi: 10.1074/jbc.M111.299313. Epub 2011 Oct 24.

cAMP-responsive element modulator (CREM)α protein induces interleukin 17A expression and mediates epigenetic alterations at the interleukin-17A gene locus in patients with systemic lupus erythematosus

Affiliations

cAMP-responsive element modulator (CREM)α protein induces interleukin 17A expression and mediates epigenetic alterations at the interleukin-17A gene locus in patients with systemic lupus erythematosus

Thomas Rauen et al. J Biol Chem. .

Abstract

IL-17A is a proinflammatory cytokine that is produced by specialized T helper cells and contributes to the development of several autoimmune diseases such as systemic lupus erythematosus (SLE). Transcription factor cAMP-responsive element modulator (CREM)α displays increased expression levels in T cells from SLE patients and has been described to account for aberrant T cell function in SLE pathogenesis. In this report, we provide evidence that CREMα physically binds to a cAMP-responsive element, CRE (-111/-104), within the proximal human IL17A promoter and increases its activity. Chromatin immunoprecipitation assays reveal that activated naïve CD4(+) T cells as well as T cells from SLE patients display increased CREMα binding to this site compared with T cells from healthy controls. The histone H3 modification pattern at the CRE site (-111/-104) and neighboring conserved noncoding sequences within the human IL17A gene locus suggests an accessible chromatin structure (H3K27 hypomethylation/H3K18 hyperacetylation) in activated naïve CD4(+) T cells and SLE T cells. H3K27 hypomethylation is accompanied by decreased cytosine phosphate guanosine (CpG)-DNA methylation in these regions in SLE T cells. Decreased recruitment of histone deacetylase (HDAC)1 and DNA methyltransferase (DNMT)3a to the CRE site (-111/-104) probably accounts for the observed epigenetic alterations. Reporter studies confirmed that DNA methylation of the IL17A promoter indeed abrogates its inducibility. Our findings demonstrate an extended role for CREMα in the immunopathogenesis of SLE because it contributes to increased expression of IL-17A.


Figures

FIGURE 1.
FIGURE 1.
CREMα overexpression induces IL-17A expression by trans-activating the human IL17A promoter. A, primary human T cells were transfected with an expression plasmid encoding human CREMα or pcDNA3 empty vector (EV), respectively. Cells were harvested 5 h after transfection, and nucleoprotein lysates were immunoblotted for CREMα expression. Equal protein load is visualized through histone H3 expression. B and C, pcDNA3 empty vector or CREMα expression plasmid was transfected into primary human T cells, and 5 h after transfection RNA was analyzed for IL-17A and 18 S rRNA expression using regular PCR (B) and real-time qPCR (C). Experiments were performed individually in T cells from four different healthy blood donors. A representative PCR image is shown in B. Bar diagram in C shows the mean relative IL-17A expression (after CREMα overexpression) ± S.D. (error bars) from four experiments. D, alignment of the CRE consensus sequence with the CRE site (−111/−104) of the proximal human IL17A promoter. Schematic below displays the IL17A reporter plasmids used for luciferase assays. IL17Ap(−195mut)-luc indicates a reporter plasmid containing a site-directed mutation at the CRE site (−111/−104). Primary human T cells were transfected with the IL17A reporter plasmids and either pcDNA3 empty vector (white bars) or CREMα expression plasmid (gray bars). Cells were lysed 5 h after transfection, and firefly luciferase activity was measured and normalized by Renilla luciferase activity. For each reporter pcDNA3 EV co-transfection was set to 1, and the relative effect mediated by CREMα was calculated. Each experiment was performed in T cells from at least four different individuals, and values are given as mean ± S.D.
FIGURE 2.
FIGURE 2.
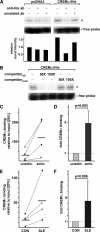
CREMα binds to a previously unidentified CRE site within the proximal IL17A promoter. A, primary human T cells were transfected either with pcDNA3 empty vector or CREMα expression plasmid for 5 h. Nucleoprotein lysates were prepared from these cells and used for DNA binding studies using a radiolabeled oligonucleotide harboring the CRE site (−111/−104) of the human IL17A promoter. DNA binding reaction was performed in the absence or presence of polyclonal anti-His6-tagged antibody (as the overexpressed CREMα contains a His6 tag) or an unrelated polyclonal antibody. Band intensities were quantified by densitometry, and relative values are shown (band in first 1 was set to 1.0). B, competition assays were performed with CREMα-containing nucleoprotein lysates, the radiolabeled CRE (−111/−104) probe and the unlabeled wild type (wt) oligonucleotide or a corresponding oligonucleotide harboring a mutated CRE site in 50- or 100-fold molar excess. C, naïve human CD4+ T cells were isolated from four healthy individuals and cultured in the absence or presence of anti-CD3/anti-CD28 antibodies for 72 h. Protein-DNA complexes were cross-linked, and ChIP assays were performed using an anti-CREMα antibody. Immunoprecipitated DNA was analyzed by real-time qPCR amplifying a region that covers the CRE site of the proximal IL17A promoter. Ratios between anti-CREMα immunoprecipitated and input DNA are shown. Dotted lines associate data from corresponding unstimulated and activated cells obtained from the same individual. Horizontal bars represent the mean of the four experiments. D, percentage of anti-CREMα immunoprecipitated DNA in the unstimulated cells from each individual analyzed in C was set to 100%, and the relative change following anti-CD3/anti-CD28 activation was calculated. Values are given as mean ± S.D. (error bars). E, ChIP was performed using total T cells from four matched pairs of SLE patients and healthy controls (CON) and anti-CREMα antibody. Immunoprecipitated DNA was analyzed by real-time qPCR using the same primers as in C. Ratios between anti-CREMα immunoprecipitated and input DNA are shown. Dotted lines associate data from the matched CON/SLE pairs. Horizontal bars represent mean values. F, percentage of anti-CREMα immunoprecipitated DNA in T cells from a control individual was set to 100%, and relative CREMα binding in the corresponding SLE patient was calculated. Values are given as mean ± S.D.
FIGURE 3.
FIGURE 3.
CREMα binding to the human IL17A promoter under Th1, Th2, and Th17 differentiation conditions. Naïve human CD4+ T cells were primed toward Th1, Th2, and Th17 lineage decisions by addition of the appropriate cytokines and antibodies for 5 days (as outlined under “Experimental Procedures”). Subsequently, CREMα binding to the IL17A-CRE was quantified by ChIP analysis and qPCR. Ratios between anti-CREMα immunoprecipitated and nonimmunoprecipitated input DNA are shown. Values are given as mean ± S.D. (error bars) from four independent experiments. Cells from each individual were cultured individually.
FIGURE 4.
FIGURE 4.
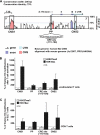
Histone H3 modifications at the human IL17A gene in response to T cell activation and in SLE T cells. A, alignment between the human and mouse IL17A gene locus. CNS (pink) were defined as regions with sequence homology of >75% between human and mouse over a length of at least 200 bp. Exons of the human IL17A gene are displayed in blue and conserved UTR regions in turquoise. The sequence of CRE site (−111/−104) within the proximal promoter is shown below. B, histone H3K27 trimethylation (gray bars) and H3K18 acetylation (black bars) was analyzed in unstimulated and activated naïve CD4+ T cells from four different healthy individuals by ChIP assays. The indicated regions of interest within the human IL17A gene were amplified by qPCR, and the proportion of immunoprecipitated DNA was calculated as relative to the input DNA in each sample. Subsequently, the ratio of relative expression was calculated between the activated and the unstimulated naïve T cells (from the same individual). The dotted line represents the methylation or acetylation status in unstimulated cells, for each of which was set to 100%. Changes in the methylation or acetylation status following T cell activation are given in the bar diagram (mean ± S.D. (error bars)). C, histone H3K27 methylation (gray bars) and H3K18 acetylation (black bars) were analyzed in total T cells from four matched control (CON)/SLE pairs by ChIP assays. The indicated regions of interest within the human IL17A gene were amplified by qPCR, and the proportion of immunoprecipitated DNA was calculated relative to the nonimmunoprecipitated input DNA in each sample. Subsequently, the ratio of relative expression was calculated between each SLE patient and the corresponding control individual. The dotted line represents the methylation or acetylation status in control T cells, each of which was set to 100%. Changes in the methylation or acetylation status in the matched SLE patient are given in the bar diagram (mean ± S.D.).
FIGURE 5.
FIGURE 5.
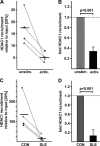
Increased HDAC1 recruitment to the CRE site (−111/−104) after T cell activation and in SLE T cells. A, HDAC1 recruitment to the CRE site (−111/−104) was analyzed in unstimulated and activated naïve CD4+ T cells from four different healthy individuals by ChIP assays using an anti-HDAC1 antibody. Immunoprecipitated DNA was analyzed by real-time qPCR amplifying a region that covers the CRE site of the proximal IL17A promoter. Ratios between anti-CREMα immunoprecipitated and input DNA are shown. Dotted lines associate data from paired unstimulated/activated naïve CD4+ T cell obtained in the same individual. Horizontal bars represent the mean of the four experiments. B, percentage of anti-HDAC1 immunoprecipitated DNA in the unstimulated cells from each individual analyzed in A was set to 100%, and the relative change following anti-CD3/anti-CD28 stimulation was calculated. Values are given as mean ± S.D. (error bars). C, ChIP was performed using total T cells from four individually matched pairs of SLE patients and healthy controls (CON) and anti-HDAC1 antibody. Immunoprecipitated DNA was analyzed by real-time qPCR using the same primers as in A. Ratios between anti-HDAC1 immunoprecipitated and input DNA are shown. Dotted lines associate data from the matched control/SLE pairs. Horizontal bars represent the mean. D, percentage of anti-HDAC1 immunoprecipitated DNA in T cells from the control individual was set to 100%, and relative HDAC1 binding in the corresponding SLE patient was calculated. Values are given as mean ± S.D.
FIGURE 6.
FIGURE 6.
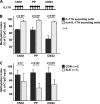
Decreased CpG-DNA methylation in IL-17A-secreting and SLE T cells. A, CpG sites within the CNS and the proximal promoter (PP) of the human IL17A gene are indicated. B, naïve CD4+ T cells from healthy blood donors that had been stimulated with anti-CD3/anti-CD28 antibodies for 72 h followed by stimulation with PMA/ionomycin for another 5 h were subjected to an IL-17A secretion assay. ChIP analyses were performed in both IL-17A-enriched T cells (black bars) and non-IL-17A-secreting T cells (gray bars), using an antibody that specifically detects methylated CpG sequences. Methylated DNA was recovered, and CNS and proximal promoter regions were amplified by real-time qPCR. Completely methylated (input, 100%) and unmethylated human DNA samples (negative control, 0%) were included. Values are given as mean ± S.D. (error bars) from four independent experiments. C, total T cells from six individually matched SLE (gray bars) and healthy control individuals (CON; black bars) were subjected to CpG-DNA immunoprecipitation. The percentage of methylated DNA is given as mean ± S.D.
FIGURE 7.
FIGURE 7.
DNMT3a recruitment to the CRE site (−111/−104) is decreased in SLE T cells. A, ChIP was performed using total T cells from four matched pairs of SLE patients and healthy controls (CON) and anti-DNMT3a antibody. Immunoprecipitated DNA was analyzed by real-time qPCR using primers detecting a portion of the IL17A promoter harboring the novel CRE site (−111/−104). Ratios between anti-DNMT3a immunoprecipitated and input DNA are shown. Dotted lines associate data from the matched control/SLE pairs. Horizontal bars represent the mean. B, percentage of anti-DNMT3a immunoprecipitated DNA in T cells from the control individual was set to 100%, and relative DNMT3a binding in the corresponding SLE patient was calculated. Values are given as mean ± S.D. (error bars). C, Jurkat T cells were transfected with pcDNA3 empty vector (EV) or an expression plasmid for DNMT3a. Relative IL-17A mRNA expression was analyzed 5 h after transfection. Values are given as mean ± S.D. from three experiments. D, schematic of CpG-DNA methylation sites within the proximal 195 bp of the IL17A reporter construct. E, pGL3-Basic and IL17Ap(−195)-luc reporter plasmids were methylated as outlined under “Experimental Procedures.” Promoter activities of the unmethylated and the methylated reporters were assessed in primary human T cells. Values are given as mean ± S.D. from three experiments.

Similar articles

Cited by

References

    1. Pappu R., Ramirez-Carrozzi V., Sambandam A. (2011) Immunology 134, 8–16 - PMC - PubMed
    1. Yao Z., Painter S. L., Fanslow W. C., Ulrich D., Macduff B. M., Spriggs M. K., Armitage R. J. (1995) J. Immunol. 155, 5483–5486 - PubMed
    1. Iwakura Y., Nakae S., Saijo S., Ishigame H. (2008) Immunol. Rev. 226, 57–79 - PubMed
    1. Nistala K., Wedderburn L. R. (2009) Rheumatology 48, 602–606 - PubMed
    1. Hundorfean G., Neurath M. F., Mudter J. (March 4, 2011) Inflamm. Bowel Dis. 10.1002/ibd.21677 - DOI - PubMed

Publication types

MeSH terms