Thousands of rab GTPases for the cell biologist
- PMID: 22022256
- PMCID: PMC3192815
- DOI: 10.1371/journal.pcbi.1002217
Thousands of rab GTPases for the cell biologist
Abstract
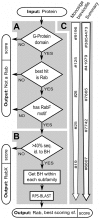
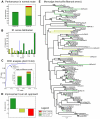
Rab proteins are small GTPases that act as essential regulators of vesicular trafficking. 44 subfamilies are known in humans, performing specific sets of functions at distinct subcellular localisations and tissues. Rab function is conserved even amongst distant orthologs. Hence, the annotation of Rabs yields functional predictions about the cell biology of trafficking. So far, annotating Rabs has been a laborious manual task not feasible for current and future genomic output of deep sequencing technologies. We developed, validated and benchmarked the Rabifier, an automated bioinformatic pipeline for the identification and classification of Rabs, which achieves up to 90% classification accuracy. We cataloged roughly 8.000 Rabs from 247 genomes covering the entire eukaryotic tree. The full Rab database and a web tool implementing the pipeline are publicly available at www.RabDB.org. For the first time, we describe and analyse the evolution of Rabs in a dataset covering the whole eukaryotic phylogeny. We found a highly dynamic family undergoing frequent taxon-specific expansions and losses. We dated the origin of human subfamilies using phylogenetic profiling, which enlarged the Rab repertoire of the Last Eukaryotic Common Ancestor with Rab14, 32 and RabL4. Furthermore, a detailed analysis of the Choanoflagellate Monosiga brevicollis Rab family pinpointed the changes that accompanied the emergence of Metazoan multicellularity, mainly an important expansion and specialisation of the secretory pathway. Lastly, we experimentally establish tissue specificity in expression of mouse Rabs and show that neo-functionalisation best explains the emergence of new human Rab subfamilies. With the Rabifier and RabDB, we provide tools that easily allows non-bioinformaticians to integrate thousands of Rabs in their analyses. RabDB is designed to enable the cell biology community to keep pace with the increasing number of fully-sequenced genomes and change the scale at which we perform comparative analysis in cell biology.
Conflict of interest statement
The authors have declared that no competing interests exist.
Figures


Similar articles
-
Bioinformatic approaches to identifying and classifying Rab proteins.Methods Mol Biol. 2015;1298:17-28. doi: 10.1007/978-1-4939-2569-8_2. Methods Mol Biol. 2015. PMID: 25800829
-
Rabifier2: an improved bioinformatic classifier of Rab GTPases.Bioinformatics. 2017 Feb 15;33(4):568-570. doi: 10.1093/bioinformatics/btw654. Bioinformatics. 2017. PMID: 27797763
-
Comprehensive analysis reveals dynamic and evolutionary plasticity of Rab GTPases and membrane traffic in Tetrahymena thermophila.PLoS Genet. 2010 Oct 14;6(10):e1001155. doi: 10.1371/journal.pgen.1001155. PLoS Genet. 2010. PMID: 20976245 Free PMC article.
-
How can mammalian Rab small GTPases be comprehensively analyzed?: Development of new tools to comprehensively analyze mammalian Rabs in membrane traffic.Histol Histopathol. 2010 Nov;25(11):1473-80. doi: 10.14670/HH-25.1473. Histol Histopathol. 2010. PMID: 20865669 Review.
-
Conservation and function of Rab small GTPases in Entamoeba: annotation of E. invadens Rab and its use for the understanding of Entamoeba biology.Exp Parasitol. 2010 Nov;126(3):337-47. doi: 10.1016/j.exppara.2010.04.014. Epub 2010 Apr 29. Exp Parasitol. 2010. PMID: 20434444 Review.
Cited by
-
VLDL Biogenesis and Secretion: It Takes a Village.Circ Res. 2024 Jan 19;134(2):226-244. doi: 10.1161/CIRCRESAHA.123.323284. Epub 2024 Jan 18. Circ Res. 2024. PMID: 38236950 Free PMC article. Review.
-
Expression and localisation of Rab44 in immune-related cells change during cell differentiation and stimulation.Sci Rep. 2020 Jul 1;10(1):10728. doi: 10.1038/s41598-020-67638-7. Sci Rep. 2020. PMID: 32612275 Free PMC article.
-
Localization of Chicken Rab22a in Cells and Its Relationship to BF or Ii Molecules and Genes.Animals (Basel). 2023 Jan 23;13(3):387. doi: 10.3390/ani13030387. Animals (Basel). 2023. PMID: 36766276 Free PMC article.
-
RAB10 promotes breast cancer proliferation migration and invasion predicting a poor prognosis for breast cancer.Sci Rep. 2023 Sep 14;13(1):15252. doi: 10.1038/s41598-023-42434-1. Sci Rep. 2023. PMID: 37709911 Free PMC article.
-
Rab GTPases and their interacting protein partners: Structural insights into Rab functional diversity.Small GTPases. 2018 Mar 4;9(1-2):22-48. doi: 10.1080/21541248.2017.1336191. Epub 2017 Jul 7. Small GTPases. 2018. PMID: 28632484 Free PMC article. Review.
References
-
- Aridor M, Hannan LA. Traffic jam: a compendium of human diseases that affect intracellular transport processes. Traffic. 2000;1:836–851. - PubMed
-
- Aridor M, Hannan LA. Traffic jams II: an update of diseases of intracellular transport. Traffic. 2002;3:781–790. - PubMed
-
- Seabra MC, Mules EH, Hume AN. Rab GTPases, intracellular traffic and disease. Trends Mol Med. 2002;8:23–30. - PubMed
Publication types
MeSH terms
Substances
LinkOut - more resources
Full Text Sources

