. 2011 Dec;157(4):1609-27.
doi: 10.1104/pp.111.188300. Epub 2011 Oct 21.

The Mediator complex in plants: structure, phylogeny, and expression profiling of representative genes in a dicot (Arabidopsis) and a monocot (rice) during reproduction and abiotic stress

Affiliations

The Mediator complex in plants: structure, phylogeny, and expression profiling of representative genes in a dicot (Arabidopsis) and a monocot (rice) during reproduction and abiotic stress

Saloni Mathur et al. Plant Physiol. 2011 Dec.

Abstract

The Mediator (Med) complex relays regulatory information from DNA-bound transcription factors to the RNA polymerase II in eukaryotes. This macromolecular unit is composed of three core subcomplexes in addition to a separable kinase module. In this study, conservation of Meds has been investigated in 16 plant species representing seven diverse groups across the plant kingdom. Using Hidden Markov Model-based conserved motif searches, we have identified all the known yeast/metazoan Med components in one or more plant groups, including the Med26 subunits, which have not been reported so far for any plant species. We also detected orthologs for the Arabidopsis (Arabidopsis thaliana) Med32, -33, -34, -35, -36, and -37 in all the plant groups, and in silico analysis identified the Med32 and Med33 subunits as apparent orthologs of yeast/metazoan Med2/29 and Med5/24, respectively. Consequently, the plant Med complex appears to be composed of one or more members of 34 subunits, as opposed to 25 and 30 members in yeast and metazoans, respectively. Despite low similarity in primary Med sequences between the plants and their fungal/metazoan partners, secondary structure modeling of these proteins revealed a remarkable similarity between them, supporting the conservation of Med organization across kingdoms. Phylogenetic analysis between plant, human, and yeast revealed single clade relatedness for 29 Med genes families in plants, plant Meds being closer to human than to yeast counterparts. Expression profiling of rice (Oryza sativa) and Arabidopsis Med genes reveals that Meds not only act as a basal regulator of gene expression but may also have specific roles in plant development and under abiotic stress conditions.


Figures

Figure 1.
Figure 1.
The distribution of the conserved HH regions of the Med complex proteins among various eukaryotes. The HH regions (boxes) are numbered from the N terminus onward for each Med protein, represented as horizontal lines. The HH regions defining the most conserved regions in plants are shown as black boxes. The number below each HH region shows its start position relative to human or Arabidopsis (marked in the shaded area) Med proteins.
Figure 2.
Figure 2.
The distribution of putative Med proteins across the plant kingdom. The Med subunits are grouped as head, middle, tail, and kinase module according to Bourbon (2008). The unknown group has members whose positions in the complex are unassigned. The left panel lists the number of biochemically purified Med proteins in S. cerevisiae (Sc), human (Hs), and Arabidopsis (At). The right panel reports the number of homologs predicted in the study for diverse plants belonging to various groups (marked at the top of each respective group) of the plant kingdom. The total numbers of Med proteins identified for an organism and for an individual Med subunit are represented in shaded boxes at the ends of the columns and rows, respectively. Organisms are as follows: G. max (Gm), P. trichocarpa (Pot), V. vinifera (Vv), C. papaya (Cap), S. lycopersicum (Sl), B. distachyon (Bd), Z. mays (Zm), S. bicolor (Sb), O. sativa (Os), P. taeda (Pit), S. moellendorffii (Sem), P. patens (Pp), V. carteri (Vc), O. lucimarinus (Ol), and C. merolae (Cm).
Figure 3.
Figure 3.
Phylogenetic relationship of Med subunits among various members of the yeast, metazoan, and plant kingdoms. Med proteins from one representative member of the seven plant groups, human (Hs), and S. cerevisiae (Sc) were assigned into the different modules of the Med complex. A, An unrooted tree of the head module constructed using the PHYLIP program by the neighbor-joining method. Numbers at the nodes represent bootstrap values from 1,000 replicates. A bootstrap value of at least 500 was used to define the Med subunits into groups A to G (see B). All the terrestrial plants (angiosperms, gymnosperms, pteridophytes, and bryophytes) are shown in green, algal members in blue, and Hs and Sc sequences in purple and black, respectively. Angiosperm-specific clades are marked by black asterisks and mixed clades by red asterisks. The scale bar represents amino acid substitutions per site. For the phylogenetic trees of the middle, tail, unknown, and kinase modules, see Supplemental Figures S1 and S2. B, Summary of the phylogenetic grouping of plants with Sc and Hs Med subunits. Groups A and B represent a single clade of all the putative Med proteins in terrestrial plants and algal members (black boxes) or at least one member of the algal group (red boxes) at 500 or greater bootstrap value. Groups C to E represent only the terrestrial plant members (either the algal members have not been predicted or do not group together with the land plants). Groups A and C include both the Sc and Hs members, while group D has only Hs members in the same clade as the plants. In groups B and E, the Sc and Hs members do not group together with plants. When the land plants did not group together to form a single clade, they were assigned to group F. Med subunits having angiosperm-specific clades are marked by asterisks.
Figure 4.
Figure 4.
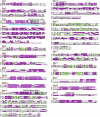
Secondary structure comparison among human, yeast, and Arabidopsis mediator sequences. The protein secondary structures were predicted using PSIPRED and superimposed on the alignments generated using MAFFT. The purple rectangles and green arrowheads denote the predicted protein helices and sheets, respectively. A solid black line indicates no secondary structure, and a dotted line denotes a gap in the alignment. Each red bar represents a length equivalent to 20 amino acids. Blue lines indicate the extent of interaction of Med4 with Med7 and Med21. Hs, Human; Sc, S. cerevisiae; At, Arabidopsis.
Figure 5.
Figure 5.
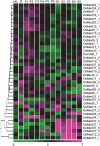
Microarray-based expression analysis of selected Med genes in rice development stages. Expression profiles of at least 2-fold differentially regulated Med genes at P ≤ 0.05, with respect to the vegetative controls (mature leaf [ML] and root [R]), are shown. Developmental stages are listed at the top of each column in the temporal order of development. Reproductive stages comprise panicle (P1–P6) and five stages of seed (S1–S5) development. Hierarchical clustering of the expression profile was done with log-transformed average values, taking mature leaf as the baseline. The color scale at the bottom of the heat map is given in log2 intensity value, whereby green represents low-level expression, black shows medium-level expression, and magenta signifies high-level expression.
Figure 6.
Figure 6.
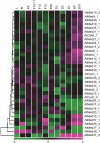
Microarray-based expression analysis of selected Med genes in Arabidopsis development stages. Expression profiles of at least 2-fold differentially regulated Med genes at P ≤ 0.05, with respect to the vegetative controls (leaf [L] and root [R]), are shown. Developmental stages are listed at the top of each column in the temporal order of development. Reproductive stages comprise flower (F9–F28) and seed (S3–S10) stages. Hierarchical clustering of the expression profile was done with log-transformed average values, taking leaf as the baseline. The color scale at the bottom of the heat map is given in log2 intensity value, whereby green represents low-level expression, black shows medium-level expression, and magenta signifies high-level expression.
Figure 7.
Figure 7.
Expression analysis of rice and Arabidopsis Med genes using a microarray. A, Expression profiles for genes that are more than 2-fold differentially regulated at P ≤ 0.05 in rice panicle (P1–P6) and seed (S1–S5) stages with respect to both the vegetative controls, leaf and root. Red and green boxes represent up- and down-regulated genes, respectively. A box marked in blue defines an opposite regulation in that substage with respect to leaf and root controls. B, Expression profiles for Arabidopsis flower (F9–F28) and seed (S3–S10) stages. C, Differentially expressing Med genes in rice in abiotic stress stages. CS, Cold stress; DS, desiccation stress; SS, salt stress.
Figure 8.
Figure 8.
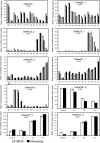
QPCR results for the expression of selected genes during development and stress and their correlation with microarray data. Three biological replicates were taken for both QPCR and microarrays. Three technical replicates were employed for each QPCR biological replicate. Error bars show se values for data obtained using both techniques. QPCR data were normalized to ease profile matching with each microarray’s data. Pearson correlation coefficients between QPCR and microarray data are indicated in parentheses. The y axis represents raw expression values obtained from microarray analysis; the x axis depicts various developmental stages or abiotic stress conditions. ML, Mature leaf; R, root; S1 to S5, seed development stages; CS, cold stress; SS, salt stress; DS, desiccation stress.
Figure 9.
Figure 9.
Microarray-based expression analysis of selected Med genes in rice during abiotic stress conditions. Expression profiles of at least 2-fold differentially regulated Med genes at P ≤ 0.05, with respect to the control (untreated 7-d-old-seedling), are shown. Hierarchical clustering of the expression profile was done with log-transformed average values taking an untreated 7-d-old-seedling as the baseline. The color scale at the bottom of the heat map is given in log2 intensity value, whereby green represents low-level expression, black shows medium-level expression, and magenta signifies high-level expression.

Similar articles

Cited by

References

    1. Agarwal P, Arora R, Ray S, Singh AK, Singh VP, Takatsuji H, Kapoor S, Tyagi AK. (2007) Genome-wide identification of C2H2 zinc-finger gene family in rice and their phylogeny and expression analysis. Plant Mol Biol 65: 467–485 - PubMed
    1. Altschul SF, Madden TL, Schäffer AA, Zhang J, Zhang Z, Miller W, Lipman DJ. (1997) Gapped BLAST and PSI-BLAST: a new generation of protein database search programs. Nucleic Acids Res 25: 3389–3402 - PMC - PubMed
    1. Ansari SA, He Q, Morse RH. (2009) Mediator complex association with constitutively transcribed genes in yeast. Proc Natl Acad Sci USA 106: 16734–16739 - PMC - PubMed
    1. Arora R, Agarwal P, Ray S, Singh AK, Singh VP, Tyagi AK, Kapoor S. (2007) MADS-box gene family in rice: genome-wide identification, organization and expression profiling during reproductive development and stress. BMC Genomics 8: 242. - PMC - PubMed
    1. Asturias FJ, Jiang YW, Myers LC, Gustafsson CM, Kornberg RD. (1999) Conserved structures of Mediator and RNA polymerase II holoenzyme. Science 283: 985–987 - PubMed

Publication types

MeSH terms