. 2011 Nov;121(11):4268-80.
doi: 10.1172/JCI59266. Epub 2011 Oct 24.

Regulatory B cell production of IL-10 inhibits lymphoma depletion during CD20 immunotherapy in mice

Affiliations

Regulatory B cell production of IL-10 inhibits lymphoma depletion during CD20 immunotherapy in mice

Mayuka Horikawa et al. J Clin Invest. 2011 Nov.

Abstract

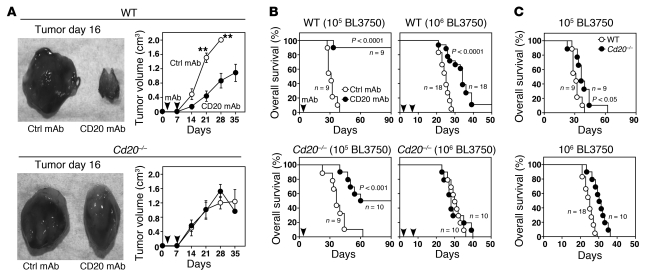
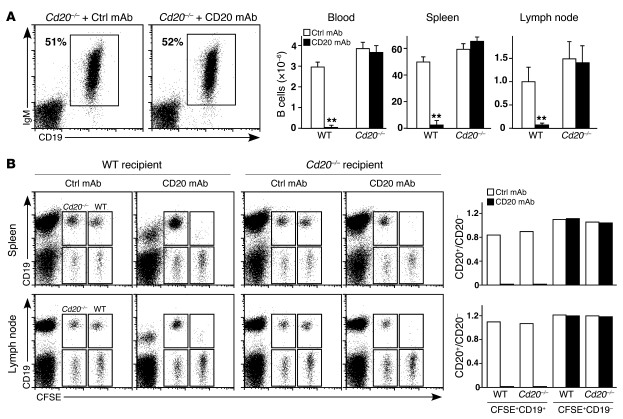
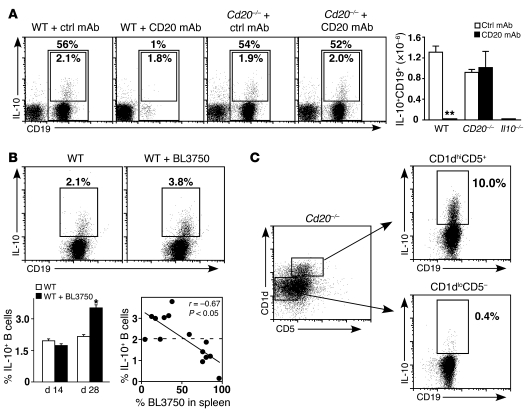
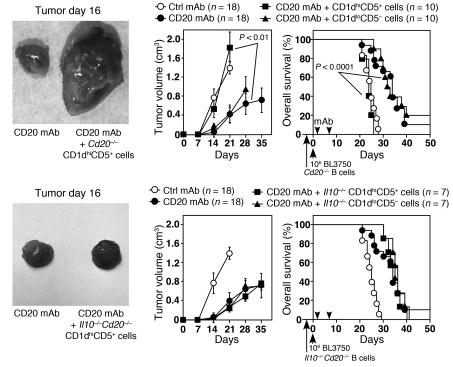
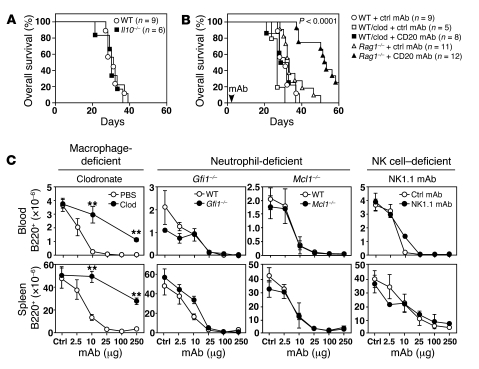
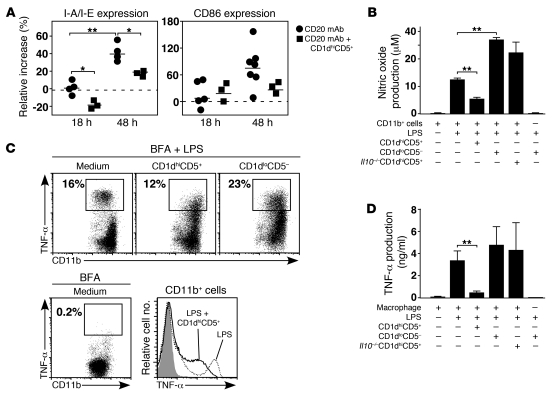
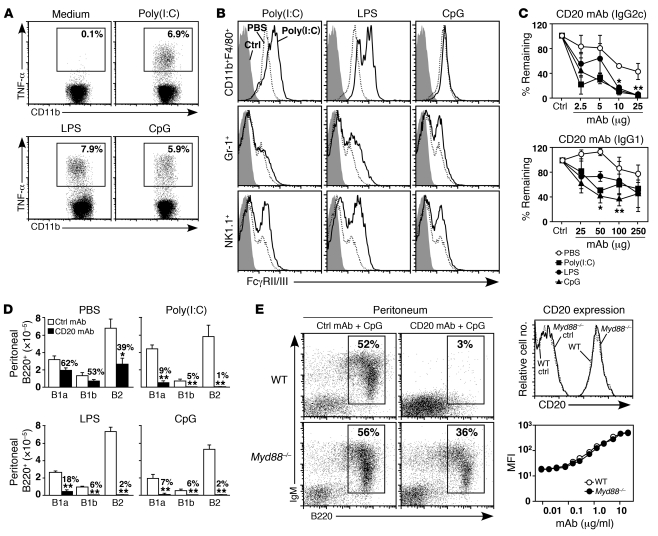
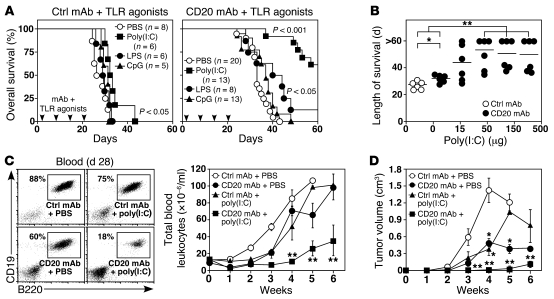
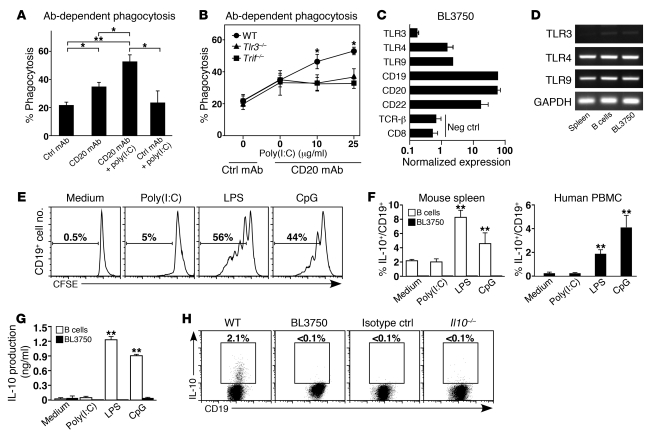
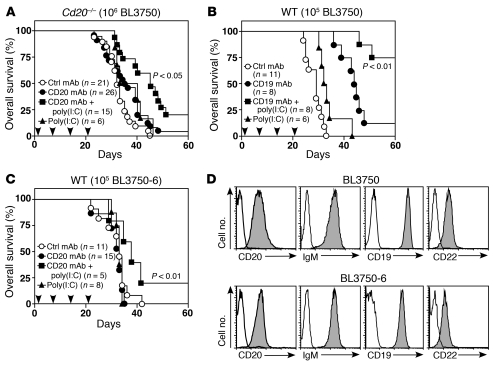
Current therapies for non-Hodgkin lymphoma commonly include CD20 mAb to deplete tumor cells. However, the response is not durable in a substantial proportion of patients. Herein, we report our studies in mice testing the hypothesis that heterogeneity in endogenous tissue CD20+ B cell depletion influences in vivo lymphoma therapy. Using highly effective CD20 mAbs that efficiently deplete endogenous mature B cells and homologous CD20+ primary lymphoma cells through monocyte- and antibody-dependent mechanisms, we found that lymphoma depletion and survival were reduced when endogenous host B cells were not depleted, particularly a rare IL-10-producing B cell subset (B10 cells) known to regulate inflammation and autoimmunity. Even small numbers of adoptively transferred B10 cells dramatically suppressed CD20 mAb-mediated lymphoma depletion by inhibiting mAb-mediated monocyte activation and effector function through IL-10-dependent mechanisms. However, the activation of innate effector cells using a TLR3 agonist that did not activate B10 cells overcame the negative regulatory effects of endogenous B10 cells and enhanced lymphoma depletion during CD20 immunotherapy in vivo. Thus, we conclude that endogenous B10 cells are potent negative regulators of innate immunity, with even small numbers of residual B10 cells able to inhibit lymphoma depletion by CD20 mAbs. Consequently, B10 cell removal could provide a way to optimize CD20 mAb-mediated clearance of malignant B cells in patients with non-Hodgkin lymphoma.


Figures

Figure 1
Figure 1. Endogenous B cells inhibit lymphoma depletion by CD20 mAbs in vivo.
(A) Representative dorsal tumors resected from control (Ctrl) or CD20 mAb–treated WT or Cd20–/– mice 16 days after receiving 106 BL3750 cells. Line graphs indicate tumor volumes for mice given CD20 (black circles) or control (white circles) mAbs (250 μg/mouse) on days 1 and 7 (arrowheads) following the transfer of 106 BL3750 cells. Values represent mean tumor volumes observed in 3–6 mice for each group from 2 independent experiments. (B) Survival of WT or Cd20–/– mice given 105 (left panels) or 106 (right panels) BL3750 cells on day 0, with CD20 (black circles) or control (white circles) mAbs given on day 1 or days 1 and 7 (arrowheads) in 3 or more independent experiments. Significant cumulative survival differences between groups treated with CD20 versus control mAbs are indicated. All mice that survived more than 90 or 50 days (as shown) remained disease free for 6 or more months. (C) Survival of WT and Cd20–/– mice given 105 or 106 BL3750 cells on day 0. Significant cumulative survival differences between WT and Cd20–/– mice are indicated. Data represent mean ± SEM.
Figure 2
Figure 2. B cell depletion by CD20 mAbs in Cd20–/– mice.
(A) Endogenous B cells in Cd20–/– mice are not depleted by CD20 mAbs. Values represent B220+ B cell numbers in WT and Cd20–/– mouse tissues 7 days after control or CD20 mAb treatment (250 μg/mouse). Identical results were also obtained in mice given 106 BL3750 cells 1 day before mAb treatment (data not shown). Blood numbers represent cells ×10–6/ml. Values represent means for 3 mice in each group and represent 4 independent experiments. Significant differences between means are indicated. **P < 0.01. (B) Efficient depletion of WT B cells by CD20 mAbs in Cd20–/– mice. Cd20–/– and WT splenocytes were CFSE labeled at different intensities, mixed equally, and transferred into WT or Cd20–/– recipients before CD20 or control mAb treatment. Spleen and peripheral lymph node lymphocytes were isolated after 3 days and stained for CD19 expression. The gates show CD19+ and CD19 lymphocytes from WT donors (CFSEhi) relative to Cd20–/– donors (CFSElo). Bar graphs indicate mean CD20+ to CD20 cell ratios within the CFSE-labeled CD19+ and CD19 lymphocyte populations from 2 independent experiments. Data represent mean ± SEM.
Figure 3
Figure 3. B10 cell subset expansion in mice with lymphoma.
(A) Representative spleen IL-10–producing B cell frequencies in control or CD20 mAb–treated WT or Cd20–/– mice. Percentages within the gates indicate mean frequencies of IL-10+ cells among CD19+ B cells (bottom numbers) and the mean relative frequency of CD19+ B cells among total lymphocytes (top numbers). Bar graph shows mean IL-10–producing B cell numbers 7 days after control or CD20 mAb treatment, with 3 or more mice/value from 2 experiments. Results with Il10–/– mice are shown as background controls for IL-10 staining. (B) Spleen B10 cell frequencies increase during lymphoma progression. Representative dot plots showing IL-10+ B cell frequencies in a mouse 28 days after BL3750 cell transfer or an untreated littermate (top panels). Percentages above the indicated gates indicate IL-10+ B cell frequencies. Bar graphs indicate mean percentages of B cells that produced IL-10 (n = 3 mice/group). Scatter plots compare frequencies of IL-10–producing CD19+ nonmalignant B cells with lymphoma invasion (percentage of BL3750 cells among total leukocytes) from individual mice 21–35 days following BL3750 cell transfers. The dashed line indicates the mean percentage of IL-10+ B cells in mice without tumors. (A and B) Significant differences between means are indicated. *P < 0.05; **P < 0.01. (C) Representative purification of splenic CD1dhiCD5+CD19+ B cells from Cd20–/– mice. The frequency of IL-10–competent B10 cells within each indicated subset is shown. Percentages indicate mean IL-10+ B cell frequencies as determined by flow cytometry analysis in 4 independent experiments. Data represent mean ± SEM.
Figure 4
Figure 4. B cell IL-10 production inhibits lymphoma depletion by CD20 mAbs in vivo.
CD1dhiCD5+ B cells inhibit lymphoma depletion by CD20 mAbs through IL-10 production. B cell subsets purified from Cd20–/– or Il10–/–Cd20–/– mice were transferred into WT recipients (2 × 10⁶/mouse) 1 day before the mice were given 106 BL3750 tumor cells on day 0. CD20 or control mAbs (250 μg) were given on days 1 and 7 (arrowheads). Representative dorsal tumors were resected from mice on day 16. Tumor volumes and cumulative mouse survival were quantified after tumor challenge and control (white circles), CD20 mAb (black circles), CD20 mAb plus CD1dhiCD5+ B cell (squares), or CD20 mAb plus non-CD1dhiCD5+ B cell (triangles) treatments. Results represent pooled data from 4 independent experiments. Significant cumulative survival differences between groups given CD1dhiCD5+ or non-CD1dhiCD5+ B cells are shown. All mice that survived more than 50 days remained disease free for 6 or more months. Data represent mean ± SEM.
Figure 5
Figure 5. Macrophages mediate lymphoma depletion following CD20 mAb treatment.
(A) IL-10 does not influence BL3750 tumor growth in vivo. WT and Il10–/– mice were given 105 BL3750 cells on day 0 with survival monitored thereafter. (B) Macrophages, but not B or T lymphocytes, mediate lymphoma depletion following CD20 mAb treatment. WT and Rag1–/– mice were given 105 BL3750 cells on day 0 with control or CD20 mAb (250 μg) treatment on day 1. Some mice were treated with clodronate-encapsulated liposomes to deplete macrophages before tumor transfers as indicated. Significant cumulative survival differences between control and CD20 mAb treatment groups are shown. Mice that survived more than 60 days remained disease free for 6 or more months. (C) Blood and spleen B cell numbers in macrophage-deficient (clodronate-treated), neutrophil-deficient (Gfi1–/– or Mcl1–/–), or NK cell–deficient (anti-NK1.1 mAb–treated) mice (black circles), and their WT littermates (white circles) 7 days after CD20 (2.5–250 μg) or control (250 μg) mAb treatment. Values represent mean B cell numbers (≥3 mice per value) at the indicated mAb doses. Significant differences between means are indicated. **P < 0.01. Data represent mean ± SEM.
Figure 6
Figure 6. B10 cells regulate macrophage activation.
(A) CD1dhiCD5+ B cells inhibit spleen CD11b+ cell activation in vivo. WT mice were untreated (circles) or given 2 × 10⁶ CD1dhiCD5+ B cells from Cd20–/– mice (squares) 1 day before BL3750 cell transfers. Mice received CD20 mAbs (250 μg) 1 day after tumor transfers. MHC class II expression by CD11b+F4/80+I-A/I-E+ cells and CD86 expression by CD11b+F4/80+ cells were assessed 18 and 48 hours after mAb treatment. Values indicate results for individual mice (bars indicate means) relative to control mAb–treated mice (dashed lines). (B) CD1dhiCD5+ B cells from WT but not Il10–/– mice inhibit nitric oxide production by CD11b+ cells. Splenic CD1dhiCD5+ or CD1dloCD5 B cells were cultured with LPS (10 μg/ml) overnight before culture with bone marrow CD11b+ cells for 48 hours, with LPS (1 μg/ml) added during the final 18 hours of culture. Values represent means from 2 independent experiments. (C) CD1dhiCD5+ B cells inhibit bone marrow CD11b+ cell TNF-α production in vitro. Splenic CD1dhiCD5+ or CD1dloCD5 B cells were stimulated with LPS (10 μg/ml) overnight before culture with CD11b+ cells for 24 hours, with brefeldin A (BFA) and LPS (1 μg/ml) added during the final 4 hours of culture. Percentages indicate cell frequencies within the indicated gates. Histogram overlays show relative TNF-α expression. (D) CD1dhiCD5+ B cells from WT but not Il10–/– mice inhibit peritoneal CD11b+ macrophage TNF-α production. The experiments were as in C. Values represent means from 2 independent experiments. (AD) Significant differences between means are shown. *P < 0.05; **P < 0.01. Data represent mean ± SEM.
Figure 7
Figure 7. TLR agonists enhance CD20 mAb–induced B cell depletion.
(A) Representative TLR-induced TNF-α production by bone marrow CD11b+ cells cultured with brefeldin A for 4 hours. (B) Representative FcγR expression by spleen CD11b+F4/80+ macrophages, Gr-1+ neutrophils, and NK1.1+ NK cells following PBS or TLR agonist treatment. FcγRII/III expression was analyzed by ex vivo immunofluorescence staining 18 hours after the mice were treated. (A and B) Results represent 2 independent experiments. (C) TLR agonists enhance peritoneal cavity B cell depletion by CD20 mAbs. Mice were given CD20 (MB20-11, IgG2c; or MB20-1, IgG1) or isotype control mAbs plus PBS (white circles), poly(I:C) (squares), LPS (black circles), or CpG (triangles). Values represent mean B220+ cell numbers in CD20 versus control mAb-treated mice after 7 days (≥3 mice/value). (D) Peritoneal B1a (CD5+ CD11b+IgMhiB220lo), B1b (CD5CD11b+IgMhi220lo), and B2 (CD5CD11bIgMhiB220hi) cell numbers in mice 7 days after CD20 (MB20-11, black bars) or control (white bars) mAb (25 μg) treatment plus PBS, poly(I:C), LPS, or CpG (≥3 mice per value). (E) CpG does not augment peritoneal cavity B cell depletion by CD20 mAbs (MB20-11, 25 μg) in Myd88–/– mice. Percentages represent mean B220+ cell frequencies 7 days after CD20 mAb treatment relative to control mAb-treated littermates (≥3 mice per value). CD19+ B cells from WT and Myd88–/– mice express similar cell-surface CD20 densities as assessed over a range of CD20 mAb concentrations relative to control mAbs (10 μg/ml) binding. (CE) Significant differences between sample means are indicated. *P < 0.05; **P < 0.01. Results represent 3–4 independent experiments. Data represent mean ± SEM.
Figure 8
Figure 8. Poly(I:C), but not LPS or CpG, enhances lymphoma depletion by CD20 mAbs.
(A) Poly(I:C) enhances CD20 mAb–induced lymphoma depletion. Control or CD20 mAbs (10 μg) were given concurrently with PBS (white circles), poly(I:C) (squares), LPS (black circles), or CpG (triangles) on days 1, 7, 14, and 21 following 105 BL3750 cell transfers. Significant cumulative survival differences between groups are indicated. B cell depletion kinetics for 10 μg MB20-11 mAbs have been described (24, 29). (B) Individual and mean (horizontal bars) mouse survival following BL3750 cell transfers with control (white circles) or CD20 mAbs (black circles) plus poly(I:C) treatment over a range of concentrations (0–500 μg, 6 mice/group). (C) Poly(I:C) enhances circulating tumor cell depletion by CD20 mAbs. Representative CD19+B220+ cell clearance 28 days following BL3750 cell transfers for the mice shown in A, with the relative frequencies of cells within the gates indicated. Line graphs indicate mean blood leukocyte numbers. (D) Tumor volumes for the mice shown in A. (A and B) All mice that survived more than 60 days remained disease free for 6 or more months. (BD) Significant differences between sample means or mice treated with CD20 mAbs alone compared with CD20 mAbs plus poly(I:C) are indicated. *P < 0.05, **P < 0.01. (C and D) At time points where insufficient numbers of mice treated with control mAb had not survived for statistical analysis, comparisons were made between mice treated with CD20 mAb plus poly(I:C) versus pooled results for viable mice treated with either CD20 mAb or poly(I:C) alone. Data represent mean ± SEM.
Figure 9
Figure 9. Poly(I:C) does not induce B10 cell proliferation or IL-10 production.
(A) Poly(I:C) enhances antibody-dependent monocyte phagocytosis of spleen B cells in vitro that is (B) TLR3 and TRIF dependent. Phagocytosis of CD20 mAb–coated CFSE-labeled B cells by poly(I:C)-treated macrophages was assessed by flow cytometry. Values indicate mean frequencies of monocytes containing CFSE-labeled B cells from 3–5 independent experiments. (C) TLR gene expression by BL3750 cells. Relative mean transcript levels are indicated. (D) TLR transcript expression by BL3750 cells, whole spleen, and purified spleen B cells was assessed by PCR amplification. GAPDH was used as a positive control. (E) Poly(I:C) does not induce spleen B cell proliferation. CSFE-labeled B cells were cultured with TLR agonists for 72 hours. Representative frequencies of dividing CD19+ cells are shown. (F) BL3750, mouse spleen (n = 3–5/group), or human blood mononuclear (n = 10–12/group) cells were stimulated for 48 hours with LPS, CpG, or poly(I:C), with PMA, ionomycin, and brefeldin A added for the last 5 hours of culture. Bar graphs indicate IL10+ B cell frequencies. (G) Poly(I:C) does not induce BL3750 or B cell IL-10 secretion. BL3750 or spleen B cells were cultured with medium alone or TLR agonists for 72 hours, with IL-10 concentrations quantified by ELISA. (H) BL3750 cells do not express cytoplasmic IL-10 after 5 hours of in vitro stimulation, relative to WT and Il10–/– mouse splenocytes. (A, B, F, and G) Significant differences between means are indicated. *P < 0.05; **P < 0.01. (BF) Results represent 2 or more independent experiments. Data represent mean ± SEM.
Figure 10
Figure 10. TLR3 activation enhances CD20 and CD19 mAb immunotherapy for lymphoma.
(A) Poly(I:C) significantly enhances CD20 mAb efficacy and survival in Cd20–/– mice following BL3750 cell (106 cells/mouse) transfers. (B) Poly(I:C) significantly enhances CD19 immunotherapy in WT mice given 105 BL3750 cells. (C) Poly(I:C) significantly enhances survival in WT mice given 105 CD20 mAb–resistant BL3750-6 lymphoma cells. (AC) Mice were given BL3750 cells 1 day before isotype control mAb (white circles, 250 μg), CD20 (250 μg), or CD19 (100 μg) mAb (black circles) treatments. Poly(I:C) (squares, triangles, 150 μg) was either given alone or with mAbs on days 1, 7, 14, and 21 (arrowheads). Significant cumulative survival differences between groups treated with mAbs plus poly(I:C) versus CD20/CD19 mAb alone and poly(I:C) alone are indicated. All mice that survived more than 60 days remained disease free for 6 or more months. (D) BL3750 and BL3750-6 cell-surface CD20, IgM, CD19, and CD22 expression (shaded histogram). Control mAb background staining is shown (thin line), with similar results from 3 or more experiments. Data represent mean ± SEM.

Similar articles

Cited by

References

    1. Anderson KC, Bates MP, Slaughenhoupt B, Pinkus G, Schlossman SF, Nadler LM. Expression of human B cell-associated antigens on leukemias and lymphomas: a model of human B cell differentiation. Blood. 1984;63(6):1424–1433. - PubMed
    1. Maloney DG, et al. IDEC-C2B8: results of a phase I multiple-dose trial in patients with relapsed non-Hodgkin’s lymphoma. J Clin Oncol. 1997;15(10):3266–3274. - PubMed
    1. Coiffier B. Rituximab therapy in malignant lymphoma. Oncogene. 2007;26(25):3603–3613. doi: 10.1038/sj.onc.1210376. - DOI - PubMed
    1. Smith MR. Rituximab (monoclonal anti-CD20 antibody): mechanisms of action and resistance. Oncogene. 2003;22(47):7359–7368. doi: 10.1038/sj.onc.1206939. - DOI - PubMed
    1. Hamaguchi Y, et al. The peritoneal cavity provides a protective niche for B1 and conventional B lymphocytes during anti-CD20 immunotherapy in mice. J Immunol. 2005;174(7):4389–4399. - PubMed

Publication types

MeSH terms