

Neighborhoods, obesity, and diabetes--a randomized social experiment
- PMID: 22010917
- PMCID: PMC3410541
- DOI: 10.1056/NEJMsa1103216
Neighborhoods, obesity, and diabetes--a randomized social experiment
Abstract
Background: The question of whether neighborhood environment contributes directly to the development of obesity and diabetes remains unresolved. The study reported on here uses data from a social experiment to assess the association of randomly assigned variation in neighborhood conditions with obesity and diabetes.
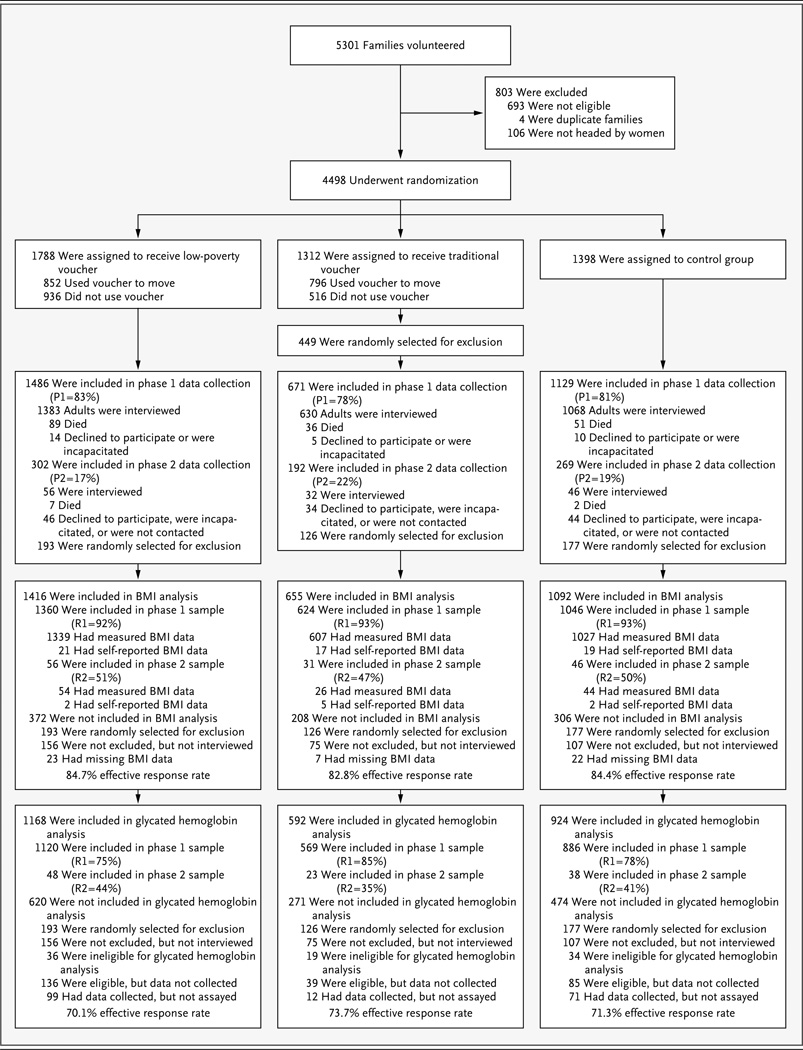
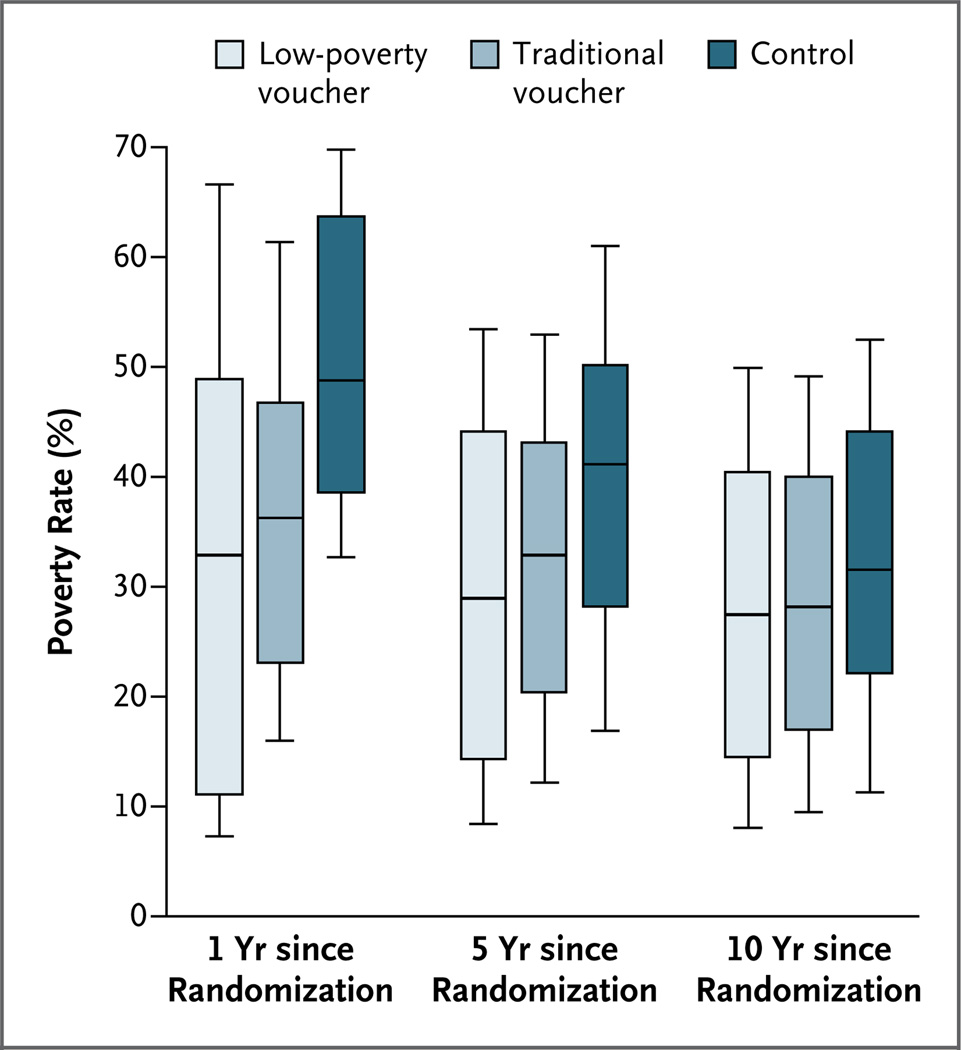
Methods: From 1994 through 1998, the Department of Housing and Urban Development (HUD) randomly assigned 4498 women with children living in public housing in high-poverty urban census tracts (in which ≥40% of residents had incomes below the federal poverty threshold) to one of three groups: 1788 were assigned to receive housing vouchers, which were redeemable only if they moved to a low-poverty census tract (where <10% of residents were poor), and counseling on moving; 1312 were assigned to receive unrestricted, traditional vouchers, with no special counseling on moving; and 1398 were assigned to a control group that was offered neither of these opportunities. From 2008 through 2010, as part of a long-term follow-up survey, we measured data indicating health outcomes, including height, weight, and level of glycated hemoglobin (HbA(1c)).
Results: As part of our long-term survey, we obtained data on body-mass index (BMI, the weight in kilograms divided by the square of the height in meters) for 84.2% of participants and data on glycated hemoglobin level for 71.3% of participants. Response rates were similar across randomized groups. The prevalences of a BMI of 35 or more, a BMI of 40 or more, and a glycated hemoglobin level of 6.5% or more were lower in the group receiving the low-poverty vouchers than in the control group, with an absolute difference of 4.61 percentage points (95% confidence interval [CI], -8.54 to -0.69), 3.38 percentage points (95% CI, -6.39 to -0.36), and 4.31 percentage points (95% CI, -7.82 to -0.80), respectively. The differences between the group receiving traditional vouchers and the control group were not significant.
Conclusions: The opportunity to move from a neighborhood with a high level of poverty to one with a lower level of poverty was associated with modest but potentially important reductions in the prevalence of extreme obesity and diabetes. The mechanisms underlying these associations remain unclear but warrant further investigation, given their potential to guide the design of community-level interventions intended to improve health. (Funded by HUD and others.).
Conflict of interest statement
No other potential conflict of interest relevant to this article was reported.
Figures
Comment in
-
Moving from high to lower level poverty neighborhoods may reduce prevalence of extreme obesity and diabetes.J Midwifery Womens Health. 2012 May-Jun;57(3):302-3. doi: 10.1111/j.1542-2011.2012.00181_3.x. J Midwifery Womens Health. 2012. PMID: 22594869 No abstract available.
Similar articles
-
Associations of housing mobility interventions for children in high-poverty neighborhoods with subsequent mental disorders during adolescence.JAMA. 2014 Mar 5;311(9):937-48. doi: 10.1001/jama.2014.607. JAMA. 2014. Retracted and republished in: JAMA. 2016 Jul 12;316(2):227-8. doi: 10.1001/jama.2016.6187 PMID: 24595778 Free PMC article. Retracted and republished. Clinical Trial.
-
Association of Neighborhood Walkability With Change in Overweight, Obesity, and Diabetes.JAMA. 2016 May 24-31;315(20):2211-20. doi: 10.1001/jama.2016.5898. JAMA. 2016. PMID: 27218630
-
Association of a Housing Mobility Program With Childhood Asthma Symptoms and Exacerbations.JAMA. 2023 May 16;329(19):1671-1681. doi: 10.1001/jama.2023.6488. JAMA. 2023. PMID: 37191703 Free PMC article.
-
Behavioral and Pharmacotherapy Weight Loss Interventions to Prevent Obesity-Related Morbidity and Mortality in Adults: An Updated Systematic Review for the U.S. Preventive Services Task Force [Internet].Rockville (MD): Agency for Healthcare Research and Quality (US); 2018 Sep. Report No.: 18-05239-EF-1. Rockville (MD): Agency for Healthcare Research and Quality (US); 2018 Sep. Report No.: 18-05239-EF-1. PMID: 30354042 Free Books & Documents. Review.
-
Behavioral Counseling to Promote a Healthful Diet and Physical Activity for Cardiovascular Disease Prevention in Adults Without Known Cardiovascular Disease Risk Factors: Updated Systematic Review for the U.S. Preventive Services Task Force [Internet].Rockville (MD): Agency for Healthcare Research and Quality (US); 2017 Jul. Report No.: 15-05222-EF-1. Rockville (MD): Agency for Healthcare Research and Quality (US); 2017 Jul. Report No.: 15-05222-EF-1. PMID: 29364620 Free Books & Documents. Review.
Cited by
-
Long-term effects of neighbourhood deprivation on diabetes risk: quasi-experimental evidence from a refugee dispersal policy in Sweden.Lancet Diabetes Endocrinol. 2016 Jun;4(6):517-24. doi: 10.1016/S2213-8587(16)30009-2. Epub 2016 Apr 27. Lancet Diabetes Endocrinol. 2016. PMID: 27131930 Free PMC article.
-
Socioeconomic and ethnic disparities along five waves of the COVID-19 pandemic: Lessons we have not yet learnt.J Nurs Scholarsh. 2023 Jan;55(1):45-55. doi: 10.1111/jnu.12816. Epub 2022 Oct 11. J Nurs Scholarsh. 2023. PMID: 36218245 Free PMC article.
-
County Poverty Concentration and Disparities in Unintentional Injury Deaths: A Fourteen-Year Analysis of 1.6 Million U.S. Fatalities.PLoS One. 2016 May 4;11(5):e0153516. doi: 10.1371/journal.pone.0153516. eCollection 2016. PLoS One. 2016. PMID: 27144919 Free PMC article.
-
Advancing research on racial-ethnic health disparities: improving measurement equivalence in studies with diverse samples.Front Public Health. 2014 Dec 22;2:282. doi: 10.3389/fpubh.2014.00282. eCollection 2014. Front Public Health. 2014. PMID: 25566524 Free PMC article. Review.
-
Unwalkable neighborhoods, poverty, and the risk of diabetes among recent immigrants to Canada compared with long-term residents.Diabetes Care. 2013 Feb;36(2):302-8. doi: 10.2337/dc12-0777. Epub 2012 Sep 17. Diabetes Care. 2013. PMID: 22988302 Free PMC article.
References
-
- Chang VW. Racial residential segregation and weight status among US adults. Soc Sci Med. 2006;63:1289–1303. - PubMed
-
- Black JL, Macinko J. The changing distribution and determinants of obesity in the neighborhoods of New York City, 2003–2007. Am J Epidemiol. 2010;171:765–775. - PubMed
-
- Morenoff JD, Diez Roux AV, Hansen BB, Osypuk TL. Residential environments and obesity: what can we learn about policy interventions from observational studies? In: Schoeni RF, House JS, Kaplan GA, Pollack H, editors. Making Americans healthier: social and economic policy as health policy. New York: Russell Sage Foundation Press; 2008. pp. 309–343.
-
- Office of the Surgeon General. Rockville, MD: Department of Health and Human Services; 2010. The surgeon general’s vision for a healthy and fit nation. - PubMed
Publication types
MeSH terms
Grants and funding
- R01 MH077026/MH/NIMH NIH HHS/United States
- R01 MH077026-05/MH/NIMH NIH HHS/United States
- 5P30 AG012857/AG/NIA NIH HHS/United States
- P01-AG005842-22S1/AG/NIA NIH HHS/United States
- R24 HD051152-04/HD/NICHD NIH HHS/United States
- 1K23AG032870-01A1/AG/NIA NIH HHS/United States
- R01 HD040404-08/HD/NICHD NIH HHS/United States
- R56 AG031259-02/AG/NIA NIH HHS/United States
- R01 HD040444-08/HD/NICHD NIH HHS/United States
- R49-CE000906/CE/NCIPC CDC HHS/United States
- R49 CE000906/CE/NCIPC CDC HHS/United States
- K23 AG032870-01A1/AG/NIA NIH HHS/United States
- R01-MH077026/MH/NIMH NIH HHS/United States
- P01 AG005842-22S1/AG/NIA NIH HHS/United States
- R01 HD040404/HD/NICHD NIH HHS/United States
- P30 AG012857-14/AG/NIA NIH HHS/United States
- R56-AG031259/AG/NIA NIH HHS/United States
- P30 AG012857/AG/NIA NIH HHS/United States
- R01-HD040444/HD/NICHD NIH HHS/United States
- R24-HD051152-04/HD/NICHD NIH HHS/United States
- R01 HD040444/HD/NICHD NIH HHS/United States
- R56 AG031259/AG/NIA NIH HHS/United States
- R24 HD051152/HD/NICHD NIH HHS/United States
- P01 AG005842/AG/NIA NIH HHS/United States
- K23 AG032870/AG/NIA NIH HHS/United States
- R01 AG031259/AG/NIA NIH HHS/United States
- R01-HD040404/HD/NICHD NIH HHS/United States
LinkOut - more resources
Full Text Sources
Other Literature Sources
Medical
Research Materials
Miscellaneous