Subtype and pathway specific responses to anticancer compounds in breast cancer
- PMID: 22003129
- PMCID: PMC3286973
- DOI: 10.1073/pnas.1018854108
Subtype and pathway specific responses to anticancer compounds in breast cancer
Abstract
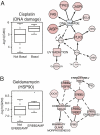
Breast cancers are comprised of molecularly distinct subtypes that may respond differently to pathway-targeted therapies now under development. Collections of breast cancer cell lines mirror many of the molecular subtypes and pathways found in tumors, suggesting that treatment of cell lines with candidate therapeutic compounds can guide identification of associations between molecular subtypes, pathways, and drug response. In a test of 77 therapeutic compounds, nearly all drugs showed differential responses across these cell lines, and approximately one third showed subtype-, pathway-, and/or genomic aberration-specific responses. These observations suggest mechanisms of response and resistance and may inform efforts to develop molecular assays that predict clinical response.
Conflict of interest statement
Conflict of interest statement: K.W.W. is an employee at Cytokinetics. P.G.S. is an employee at Millenium Pharmaceuticals. L.T.V. is an employee at Hoffman-LaRoche. J.G., K.E.B. M.A.H. and R.F.W., are employees and stockholders of GlaxoSmithKline. L.J.M. is an employee at Progen.
Figures


Similar articles
-
Linking signaling pathways to transcriptional programs in breast cancer.Genome Res. 2014 Nov;24(11):1869-80. doi: 10.1101/gr.173039.114. Epub 2014 Sep 2. Genome Res. 2014. PMID: 25183703 Free PMC article.
-
Distinct genes related to drug response identified in ER positive and ER negative breast cancer cell lines.PLoS One. 2012;7(7):e40900. doi: 10.1371/journal.pone.0040900. Epub 2012 Jul 16. PLoS One. 2012. PMID: 22815861 Free PMC article.
-
An integration of complementary strategies for gene-expression analysis to reveal novel therapeutic opportunities for breast cancer.Breast Cancer Res. 2009;11(4):R55. doi: 10.1186/bcr2344. Epub 2009 Jul 28. Breast Cancer Res. 2009. PMID: 19638211 Free PMC article.
-
Molecular biology in breast cancer: intrinsic subtypes and signaling pathways.Cancer Treat Rev. 2012 Oct;38(6):698-707. doi: 10.1016/j.ctrv.2011.11.005. Epub 2011 Dec 16. Cancer Treat Rev. 2012. PMID: 22178455 Review.
-
Inhibitors of the PI3K/Akt/mTOR pathway: new hope for breast cancer patients.Recent Pat Anticancer Drug Discov. 2010 Jan;5(1):29-57. doi: 10.2174/157489210789702208. Recent Pat Anticancer Drug Discov. 2010. PMID: 19751211 Review.
Cited by
-
An integrative and comparative study of pan-cancer transcriptomes reveals distinct cancer common and specific signatures.Sci Rep. 2016 Sep 16;6:33398. doi: 10.1038/srep33398. Sci Rep. 2016. PMID: 27633916 Free PMC article.
-
The UCSC Interaction Browser: multidimensional data views in pathway context.Nucleic Acids Res. 2013 Jul;41(Web Server issue):W218-24. doi: 10.1093/nar/gkt473. Epub 2013 Jun 8. Nucleic Acids Res. 2013. PMID: 23748957 Free PMC article.
-
Transcriptome- and proteome-oriented identification of dysregulated eIF4G, STAT3, and Hippo pathways altered by PIK3CA H1047R in HER2/ER-positive breast cancer.Breast Cancer Res Treat. 2016 Dec;160(3):457-474. doi: 10.1007/s10549-016-4011-9. Epub 2016 Oct 22. Breast Cancer Res Treat. 2016. PMID: 27771839 Free PMC article.
-
Metabolic reprogramming in triple-negative breast cancer through Myc suppression of TXNIP.Proc Natl Acad Sci U S A. 2015 Apr 28;112(17):5425-30. doi: 10.1073/pnas.1501555112. Epub 2015 Apr 13. Proc Natl Acad Sci U S A. 2015. PMID: 25870263 Free PMC article.
-
Stimulus-dependent differences in signalling regulate epithelial-mesenchymal plasticity and change the effects of drugs in breast cancer cell lines.Cell Commun Signal. 2015 May 15;13:26. doi: 10.1186/s12964-015-0106-x. Cell Commun Signal. 2015. PMID: 25975820 Free PMC article.
References
-
- Anonymous New Medicines Database | PHRMA. 2010 Available at http://newmeds.phrma.org/. Accessed September, 2011.
-
- Sawyers C. Targeted cancer therapy. Nature. 2004;432:294–297. - PubMed
-
- Paez JG, et al. EGFR mutations in lung cancer: Correlation with clinical response to gefitinib therapy. Science. 2004;304:1497–1500. - PubMed
-
- Konecny GE, et al. Activity of the dual kinase inhibitor lapatinib (GW572016) against HER-2-overexpressing and trastuzumab-treated breast cancer cells. Cancer Res. 2006;66:1630–1639. - PubMed
Publication types
MeSH terms
Substances
Grants and funding
LinkOut - more resources
Full Text Sources
Other Literature Sources
Medical
Molecular Biology Databases

