. 2011 Oct 14;147(2):370-81.
doi: 10.1016/j.cell.2011.09.041.

An extensive microRNA-mediated network of RNA-RNA interactions regulates established oncogenic pathways in glioblastoma

Affiliations

An extensive microRNA-mediated network of RNA-RNA interactions regulates established oncogenic pathways in glioblastoma

Pavel Sumazin et al. Cell. .

Abstract

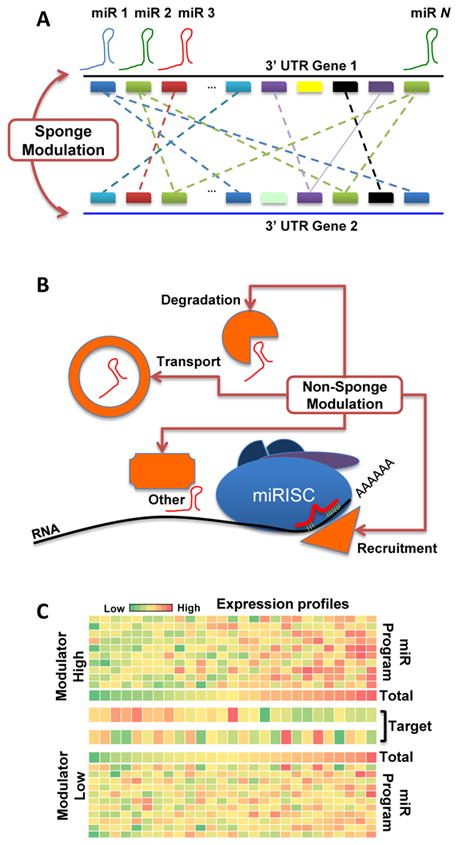
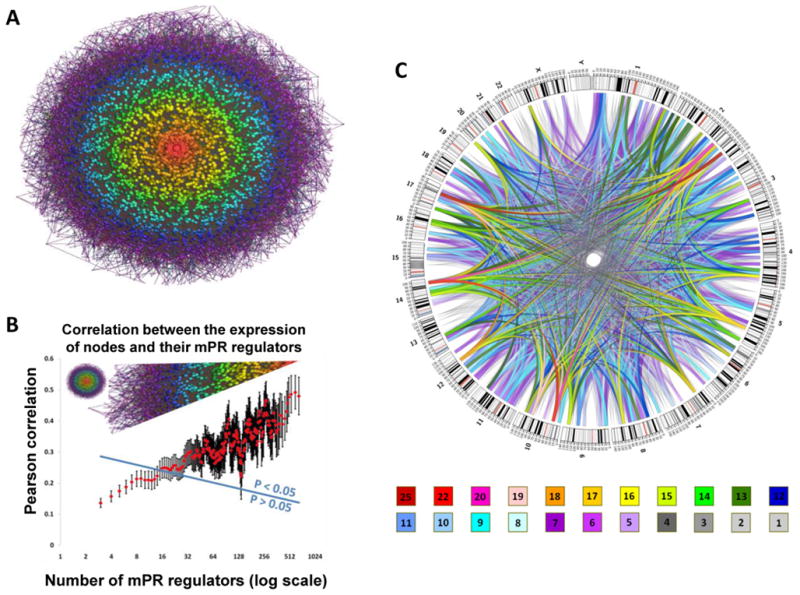
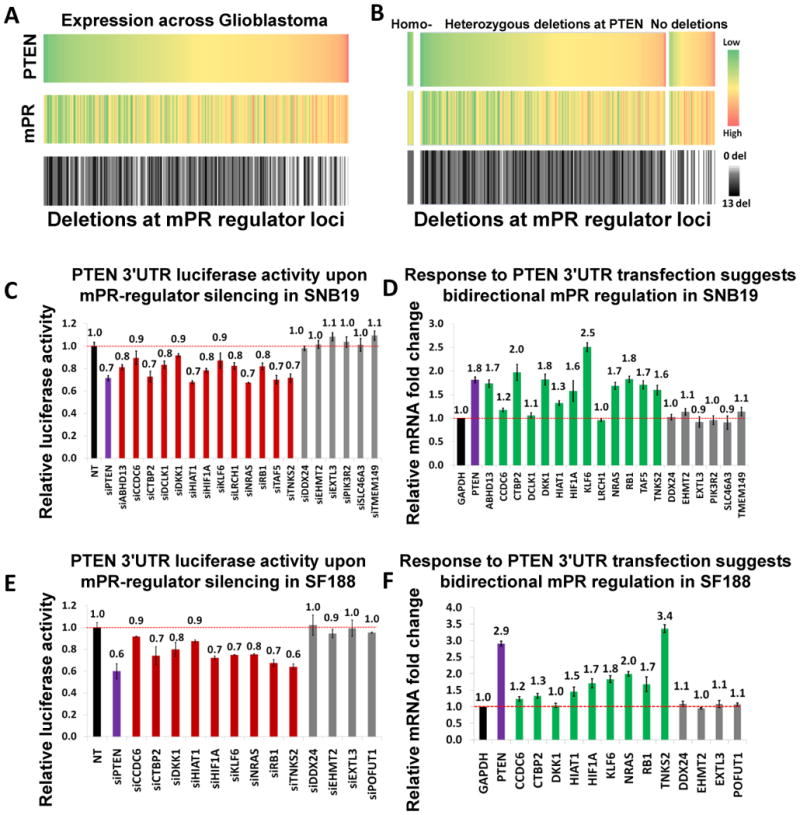
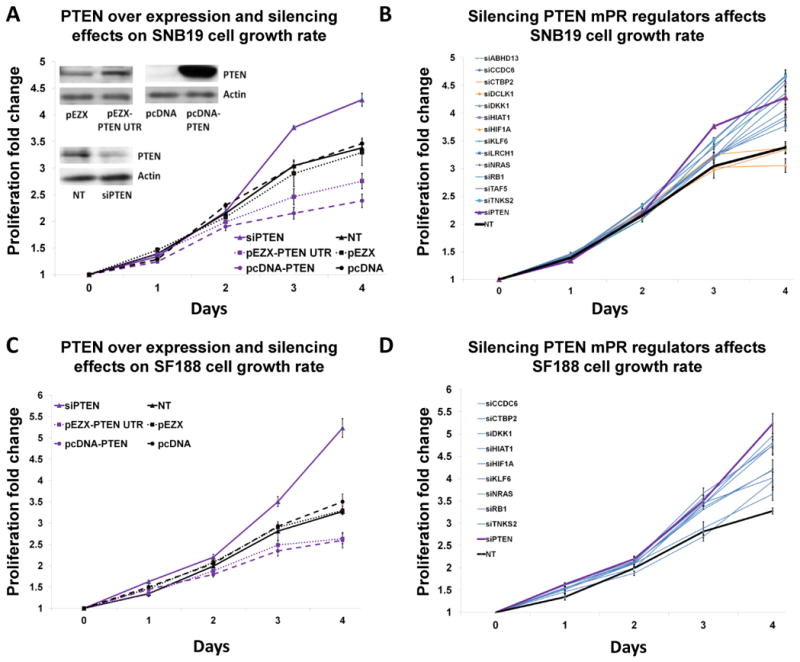
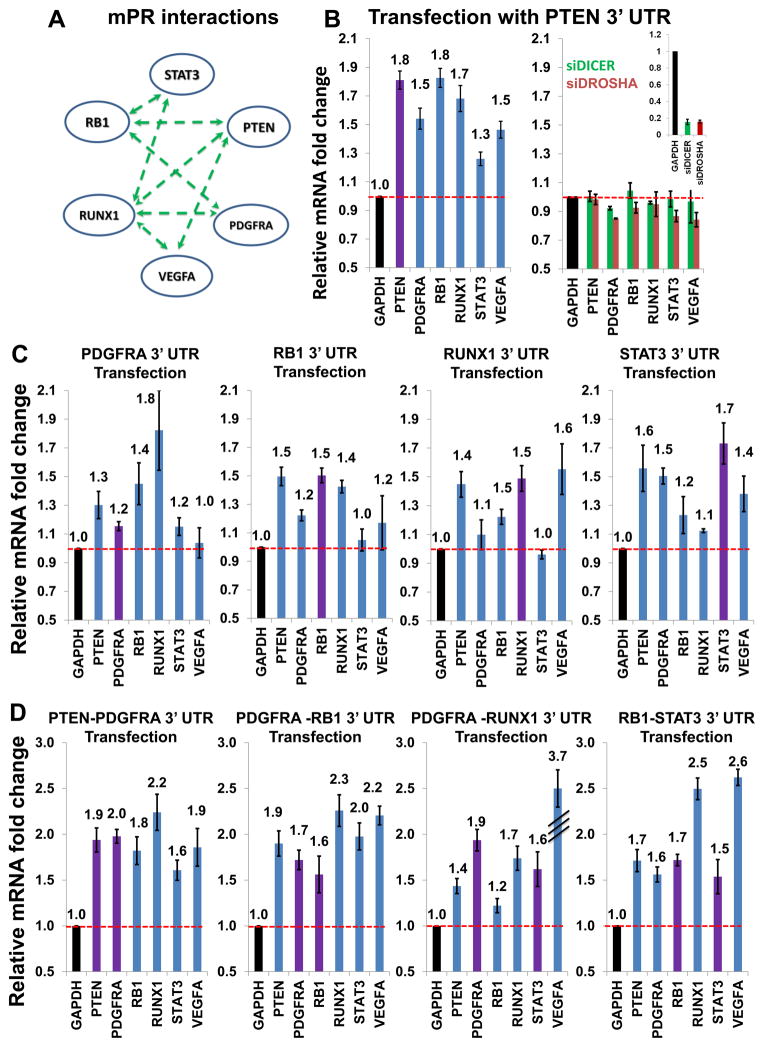
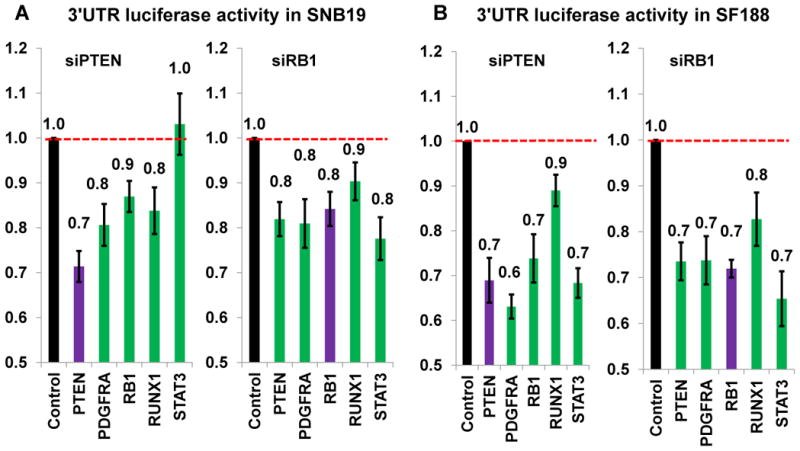
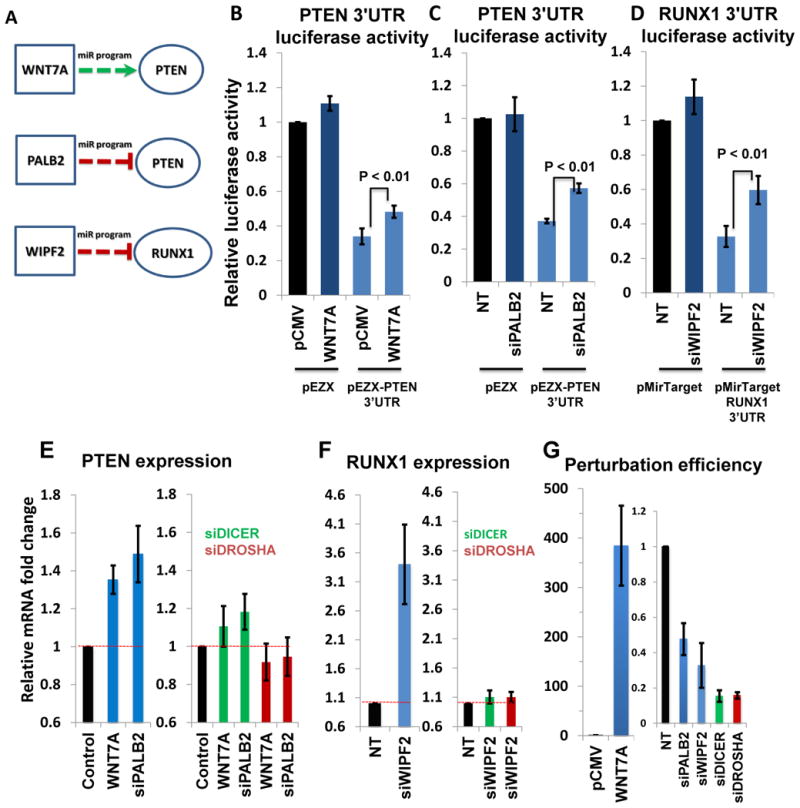
By analyzing gene expression data in glioblastoma in combination with matched microRNA profiles, we have uncovered a posttranscriptional regulation layer of surprising magnitude, comprising more than 248,000 microRNA (miR)-mediated interactions. These include ∼7,000 genes whose transcripts act as miR "sponges" and 148 genes that act through alternative, nonsponge interactions. Biochemical analyses in cell lines confirmed that this network regulates established drivers of tumor initiation and subtype implementation, including PTEN, PDGFRA, RB1, VEGFA, STAT3, and RUNX1, suggesting that these interactions mediate crosstalk between canonical oncogenic pathways. siRNA silencing of 13 miR-mediated PTEN regulators, whose locus deletions are predictive of PTEN expression variability, was sufficient to downregulate PTEN in a 3'UTR-dependent manner and to increase tumor cell growth rates. Thus, miR-mediated interactions provide a mechanistic, experimentally validated rationale for the loss of PTEN expression in a large number of glioma samples with an intact PTEN locus.


Figures

Figure 1
Figure 1. MiR-activity modulators
MiR activity modulation may be implemented by several distinct mechanisms. We consider competition by RNAs for a common miR program (sponge effect) separately from other mechanisms, such as those driven by protein-protein or protein-miR interactions. (A) RNAs modulate each other through their common miR-regulatory program. Up/down changes to the expression of one RNA perturb the relative abundance of functioning miRs that target both RNAs, leading to a corresponding up/down regulation of the second RNA. (B) Non-sponge modulators regulate miR-activity by assisting or inhibiting components of the miR-mediated post-transcriptional regulatory apparatus. These regulators may help or prevent recruitment of miRISC to the target RNA or affect target degradation and transport. (C) To identify candidate modulators, we sought out instances where the correlation between the total expression of a miR program and its target is dependent on the expression of a candidate modulator. This image visualizes a simplification of the process. The top heatmap shows expression of miRs in a program (rows) across all samples (columns) where the modulator expression is high, with the bottom line showing the total expression of the miR-program in the sample. Samples are sorted low to high based on miR-program expression. Below that is the expression of the target of the miR-program. The top heatmap shows strong inverse correlation between miR-program expression and target expression, consistent with an active miR program. The bottom heatmap shows the same data but this time for samples where modulator expression is low. Here, the negative correlation between miR-program expression and target expression is reduced, which is indicative of a suppressed miR program.
Figure 2
Figure 2. The mPR network
(related to Figure S1 and Data S1). (A) Genome-wide inference of sponge modulators identified a miR-program mediated post-transcriptional regulatory (mPR) network including ~248,000 interactions. Its graphic visualization uses nodes to represent individual RNAs and edges to represent miR-program mediated RNA-RNA interactions. Nodes near the center of the graph are contained within more tightly regulated, dense sub-graphs, with the densest 564-node sub-graph shown in red at the center of the network. The network is scale free, and the color bands, which include nodes with similar connectivity, have a size that increases exponentially with the distance from the center. (B) The correlation between expression of RNAs and the total expression of their mPR regulators (i.e., all its mPR neighbors) is plotted as a function of the number of its mPR regulators; genes at the center of the mPR network are regulated by hundreds of mPR regulators and are significantly correlated with their total expression. Values above the blue line are statistically significant at p < 0.05. (C) The 564-node mPR sub-graph facilitates interactions between the loci of distal genes. Colors designate the number of gene-to-gene edges connecting each 10Mb chromosomal region.
Figure 3
Figure 3. PTEN expression is correlated with the expression of its mPR regulators
(related to Figure S2 and to Data S1). (A) PTEN is targeted by >500 mPR regulators and its expression is correlated with both their total gene expression and with deletions at their loci; in aggregate, 97% of the TCGA glioma tumors have at least one deletion in a PTEN mPR-regulator locus. We selected 13 mPR regulators of PTEN with enriched locus deletions in PTEN intact tumors. As shown, their collective deletions and total expression are both significantly correlated with PTEN expression (pD < 2e-10 and pE < 5e-23, respectively). (B) Surprisingly, the correlation between PTEN and the aggregate expression across the 13 genes is significant in both samples with an intact PTEN locus and samples with heterozygous deletions (rD = 0.40, pD < 1e-09 and rWT = 0.46, pWT < 4e-04 by Pearson correlation, respectively). The range of PTEN expression in PTEN heterozygously deleted samples and in samples with an intact PTEN locus was virtually the same. (C) Individual siRNA mediated silencing of 13 PTEN mPR regulators reduced PTEN 3′ UTR luciferase activity in SNB19 cells at 24h. Negative control targets (in grey) were unaffected. (D) Ectopic expression of PTEN 3′ UTR increased expression of 13 PTEN mPR regulators in SNB19 cells at 24h, compared to empty vector. Negative control targets (in grey) were unaffected. (E,F) Results in SNB19 were replicated in SNF188 cells for genes that are expressed in this cell line. Fold change was measured by qRT-PCR. Data are represented as mean ± SEM.
Figure 4
Figure 4. Silencing of PTEN mPR regulators accelerates tumor cell growth
(related to Figure S3). (A) Cell proliferation assays were performed at 24h intervals, up to 4 days, following siRNA mediated PTEN silencing, PTEN cDNA ectopic expression, and PTEN 3′ UTR ectopic expression. Protein levels of PTEN were assessed by Western blotting at day 1. (B) Cell proliferation assays were performed at 24h intervals, up to 4 days, following siRNA mediated silencing of 13 PTEN mPR regulators. Non-target (NT) siRNA was used as a control. (C,D) Results in SNB19 were replicated in SNF188 cells for genes that are expressed in this cell line. Data are represented as mean ± SEM.
Figure 5
Figure 5. 3′ UTR transfections confirm miR-mediated interactions between key drivers of glioma
(related to Figure S4). (A) A tightly interconnected mPR network subgraph was identified, which includes established drivers of gliomagenesis. Sponge-mediated interactions inferred by Hermes are shown as dotted green lines. (B) Gene expression fold change of PTEN, PDGFRA, RB1, RUNX1, STAT3, and VEGFA at 24h following ectopic expression of PTEN 3′ UTR, compared to an empty vector, with (right panel) and without (left panel) siRNA mediated silencing of DICER and DROSHA. (C) Gene expression fold change of PTEN, PDGFRA, RB1, RUNX1, STAT3, and VEGFA at 24h following ectopic expression of PDGFRA, RB1, RUNX1 and STAT3 3′ UTRs, compared to empty vector. (D) Gene expression fold change of PTEN, PDGFRA, RB1, RUNX1, STAT3, and VEGFA at 24h following ectopic expression of 3′ UTR pairs, including double transfections of PTEN and PDGFRA, PDGFRA and RB1, PDGFRA and STAT3, and RB1 and STAT3. Gene expression was assessed by qRT-PCR. To highlight the significance of the change, Note that Y-axes start at 0.5 to better visualize the ratio between the experimental error and the change in expression. Data are represented as mean ± SEM.
Figure 6
Figure 6. 3′ UTR luciferase activity assays confirm miR-mediated interactions between key drivers of glioma
(A) 3′ UTR luciferase activity of PTEN, PDGFRA, RB1, RUNX1 and STAT3 were measured in SNB19 cells at 24h following siRNA mediated silencing of PTEN and RB1 compared to non-targeting siRNAs (NT5) as control (in black). (B) Results in SNB19 were replicated in SNF188 cells. Similar to Figure 5, Y-axes start at 0.5. Data are represented as mean +/− SEM.
Figure 7
Figure 7. Validation of non-sponge miR-activity modulators
(related to Figure S5). (A) Validated non-sponge modulators include WNT7A and PALB2 (predicted to induce miR-dependent upregulation and downregulation of PTEN, respectively), and WIPF2 (predicted to induce miR-dependent downregulation of RUNX1). (B) PTEN 3′ UTR luciferase activity and activity of the empty luciferase vector (pEZX) were measured at 24h following ectopic expression of pCMV-WNT7A or empty vector pCMV. (C) PTEN 3′ UTR luciferase activity and activity of the empty luciferase vector (pEZX) were measured at 24h following siRNA mediated silencing of PALB2 vs. non-target siRNA. (D) RUNX1 3′ UTR luciferase activity (pMirTarget-RUNX1 3′ UTR) and activity of the empty luciferase vector (pMirTarget) at 24h following siRNA mediated silencing of WIPF2 and non-target (NT5) siRNA. (E) qRT-PCR analysis of PTEN gene expression fold change at 24h, following ectopic expression of WNT7A and siRNA mediated silencing of PALB2, without (left) and with (right) siRNA mediated silencing of DROSHA and DICER. (F) qRT-PCR analysis of RUNX1 gene expression fold change at 24h, following siRNA mediated silencing of WIPF2, without (left) and with (right) siRNA mediated silencing of DROSHA and DICER. (G) Efficiency of WNT7A ectopic expression and of siRNA mediated silencing of PALB2, WIPF2, DICER and DROSHA, measured by qRT-PCR analysis. Data are represented as mean ± SEM.

Comment in

  • Epigenetics. Layer by layer.
    McCarthy N. McCarthy N. Nat Rev Cancer. 2011 Nov 3;11(12):830. doi: 10.1038/nrc3172. Nat Rev Cancer. 2011. PMID: 22048565 No abstract available.
  • Regulatory RNA: layer by layer.
    McCarthy N. McCarthy N. Nat Rev Genet. 2011 Nov 3;12(12):804. doi: 10.1038/nrg3108. Nat Rev Genet. 2011. PMID: 22048663 No abstract available.
  • RNA: a new layer of regulation.
    David R. David R. Nat Rev Mol Cell Biol. 2011 Nov 3;12(12):766. doi: 10.1038/nrm3225. Nat Rev Mol Cell Biol. 2011. PMID: 22048709 No abstract available.
  • ceRNAs: miRNA target mimic mimics.
    Rubio-Somoza I, Weigel D, Franco-Zorilla JM, García JA, Paz-Ares J. Rubio-Somoza I, et al. Cell. 2011 Dec 23;147(7):1431-2. doi: 10.1016/j.cell.2011.12.003. Cell. 2011. PMID: 22196719 No abstract available.

Similar articles

Cited by

References

    1. Arvey A, Larsson E, Sander C, Leslie CS, Marks DS. Target mRNA abundance dilutes microRNA and siRNA activity. Mol Syst Biol. 2010;6:363. - PMC - PubMed
    1. Barrat A, Barthelemy M, Vespignani A. Dynamical processes on complex networks. Cambridge, UK, New York: Cambridge University Press; 2008.
    1. Carro MS, Lim WK, Alvarez MJ, Bollo RJ, Zhao X, Snyder EY, Sulman EP, Anne SL, Doetsch F, Colman H, et al. The transcriptional network for mesenchymal transformation of brain tumours. Nature. 2010;463:318–325. - PMC - PubMed
    1. Cesana, et al. this issue of Cell. 2011.
    1. Chatterjee S, Fasler M, Bussing I, Grosshans H. Target-mediated protection of endogenous microRNAs in C. elegans. Dev Cell. 2011;20:388–396. - PubMed

Publication types